
Our Work
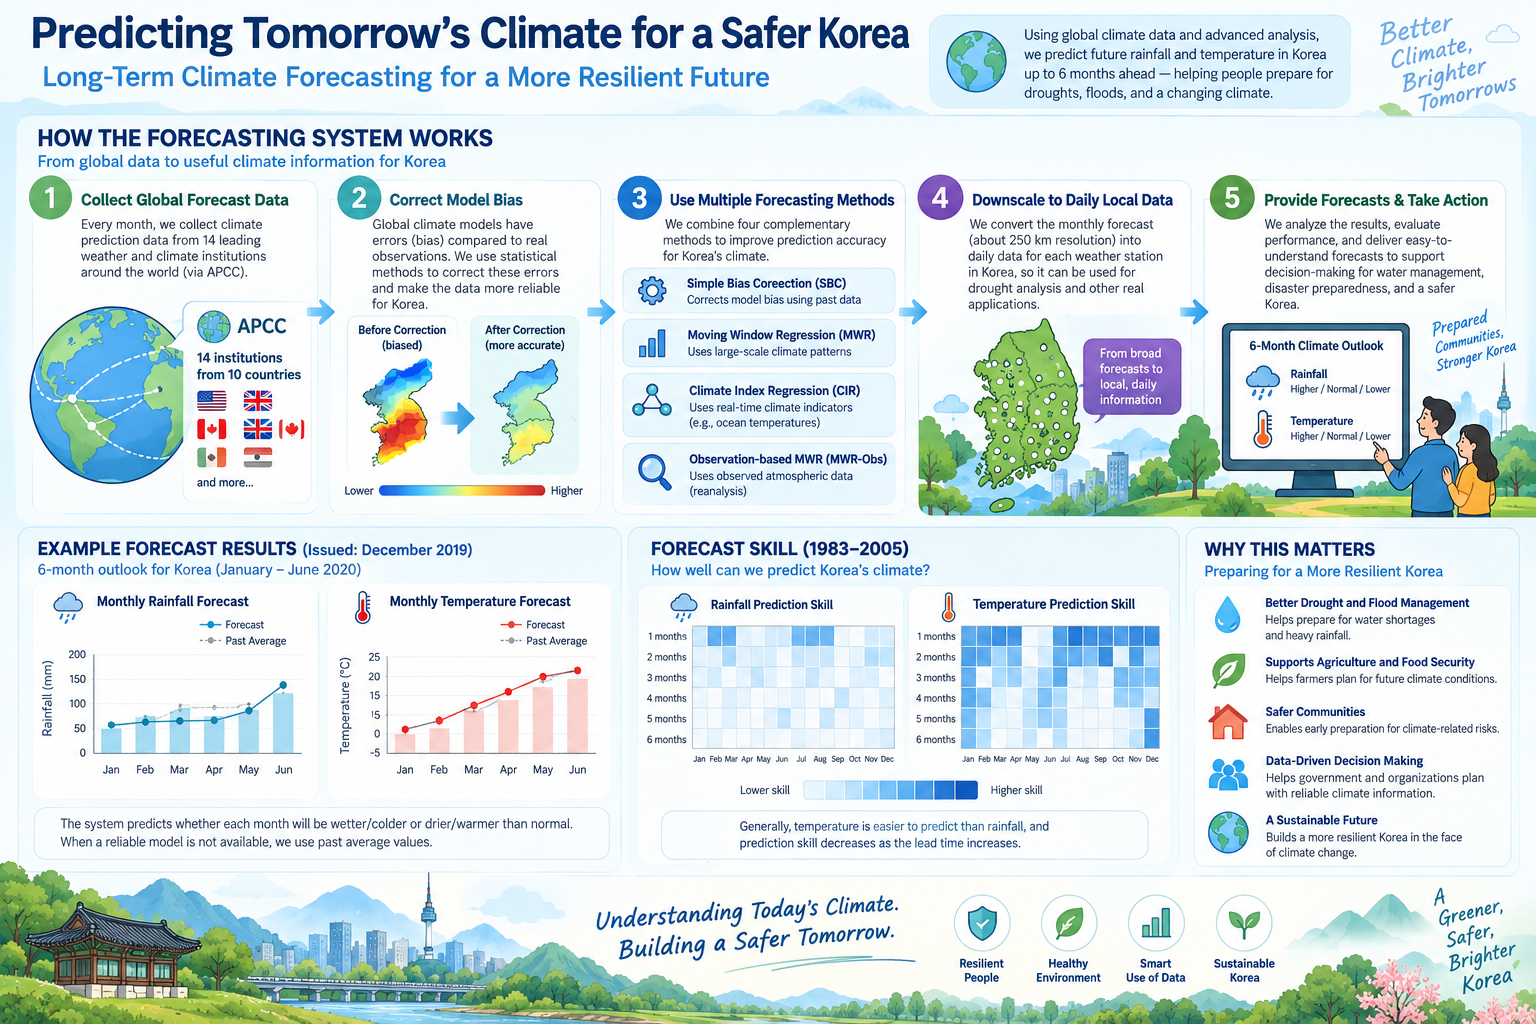
Long-Range Climate Forecasting for the Gyeonggi Agricultural Drought Prediction System
The Institute of Watershed Management (IWMI) developed the long-range climate forecasting component of the Gyeonggi Agricultural Drought Pre…
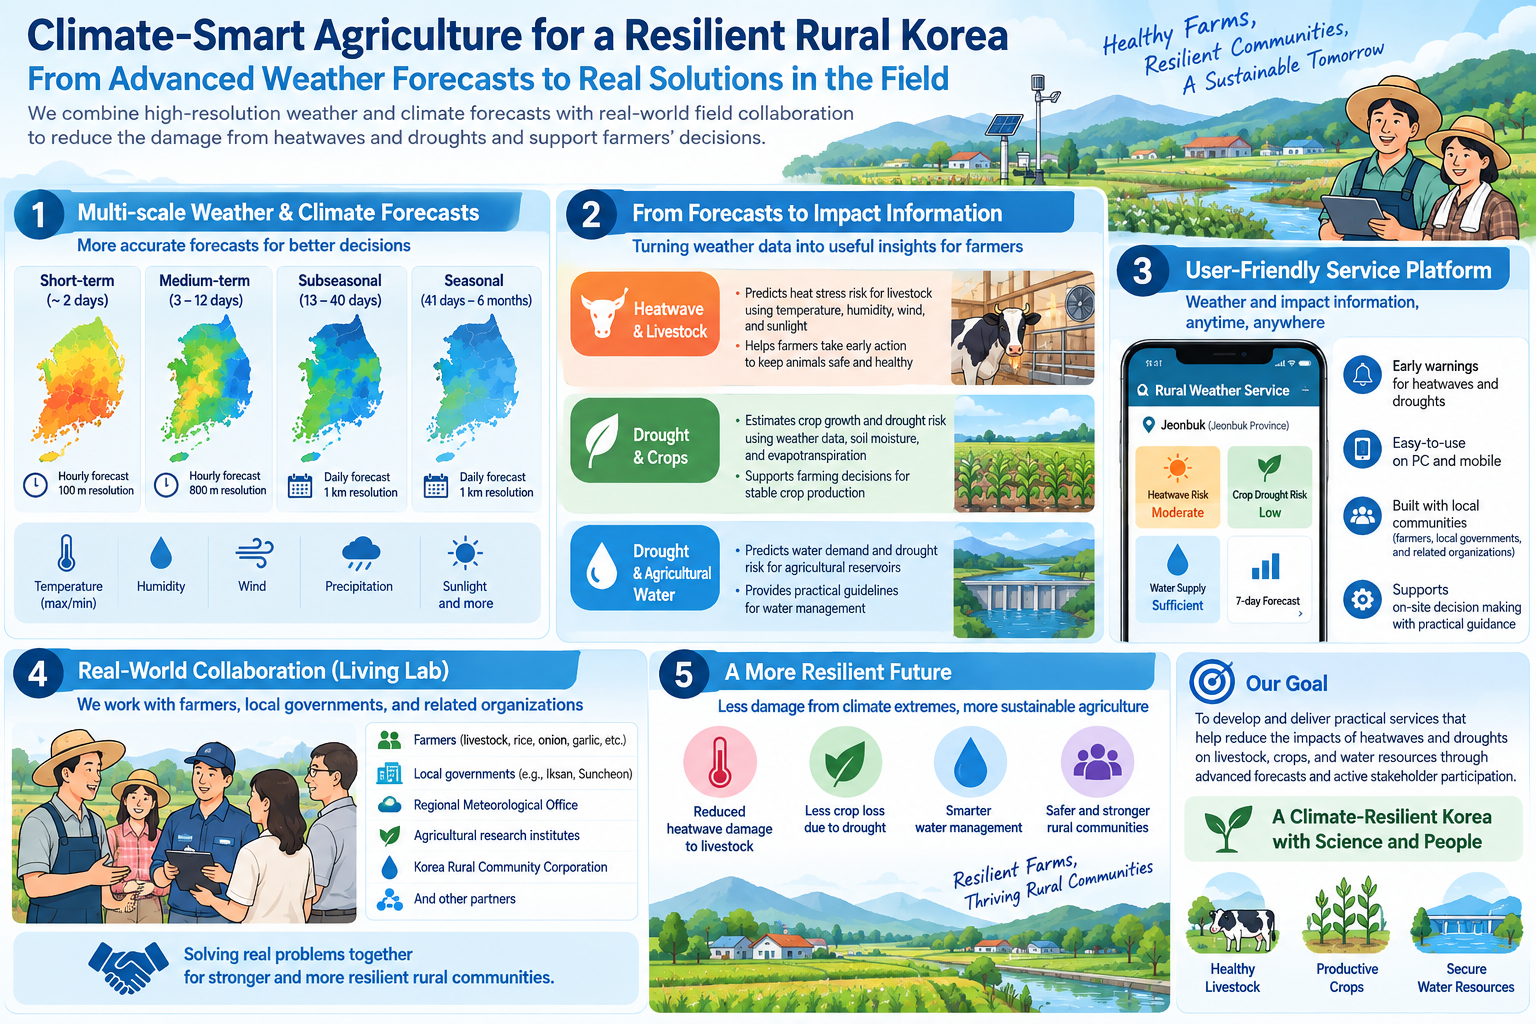
A Living Lab Demonstration Model for Reducing Heat and Drought Damage
The Institute of Watershed Management (IWMI) participated as a joint research institution in a project to establish a demonstration model fo…
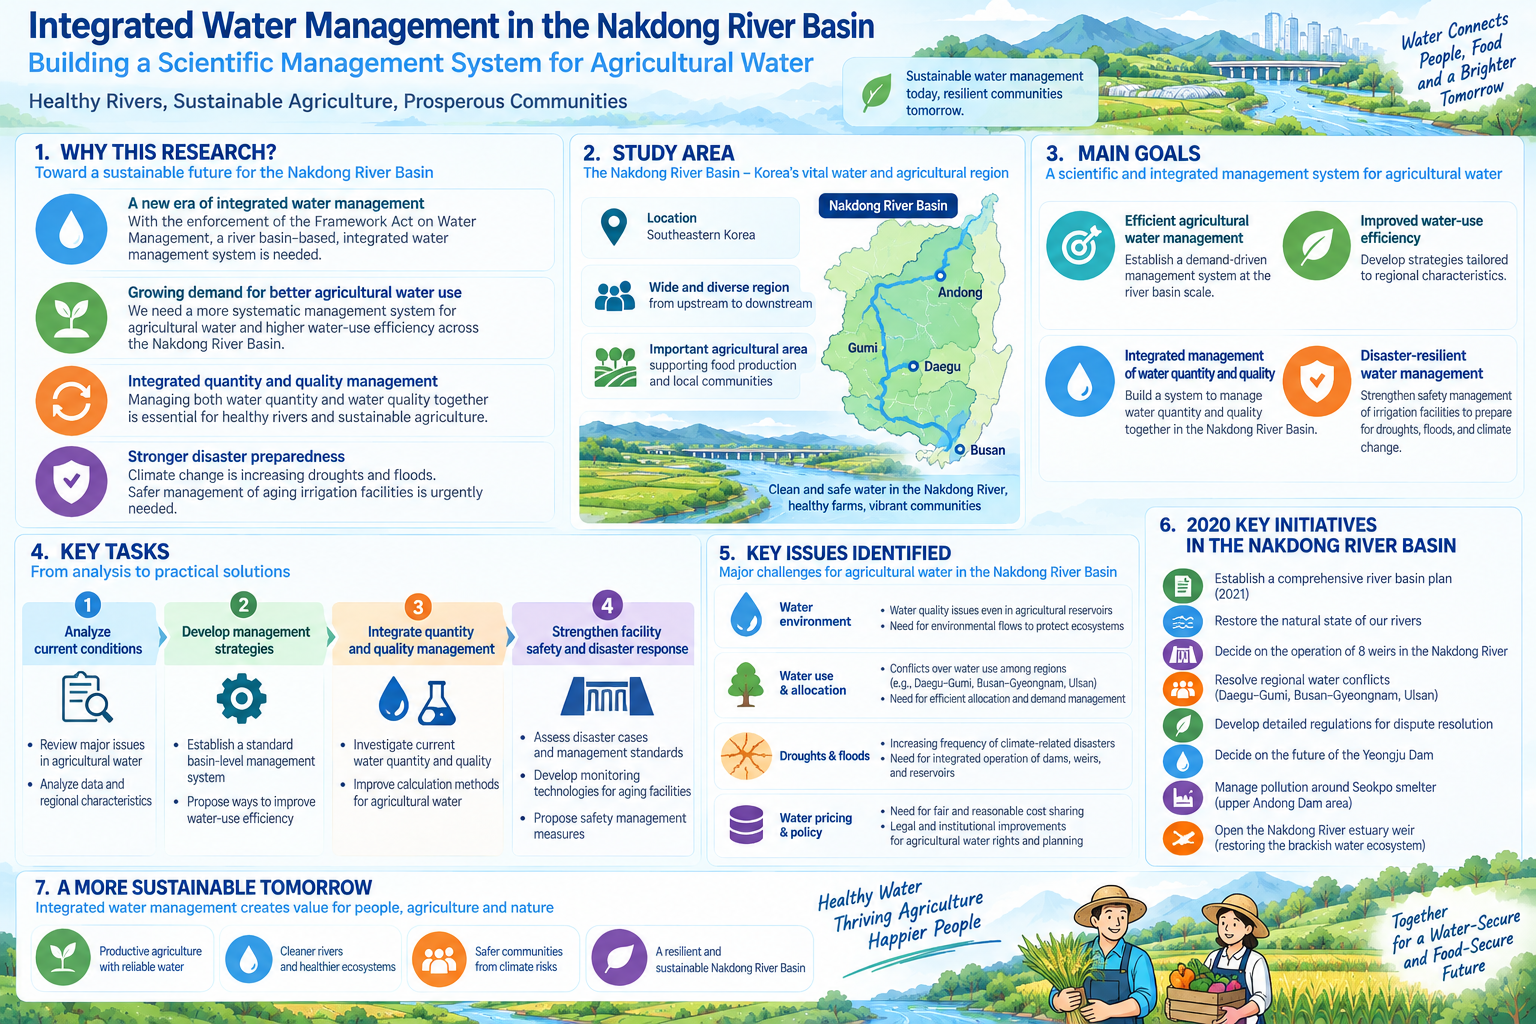
Agricultural Water Management under Integrated Water Resources Management in the Nakdong River Basin
The Institute of Watershed Management (IWMI) conducted a study on scientific agricultural water management under integrated water resources …
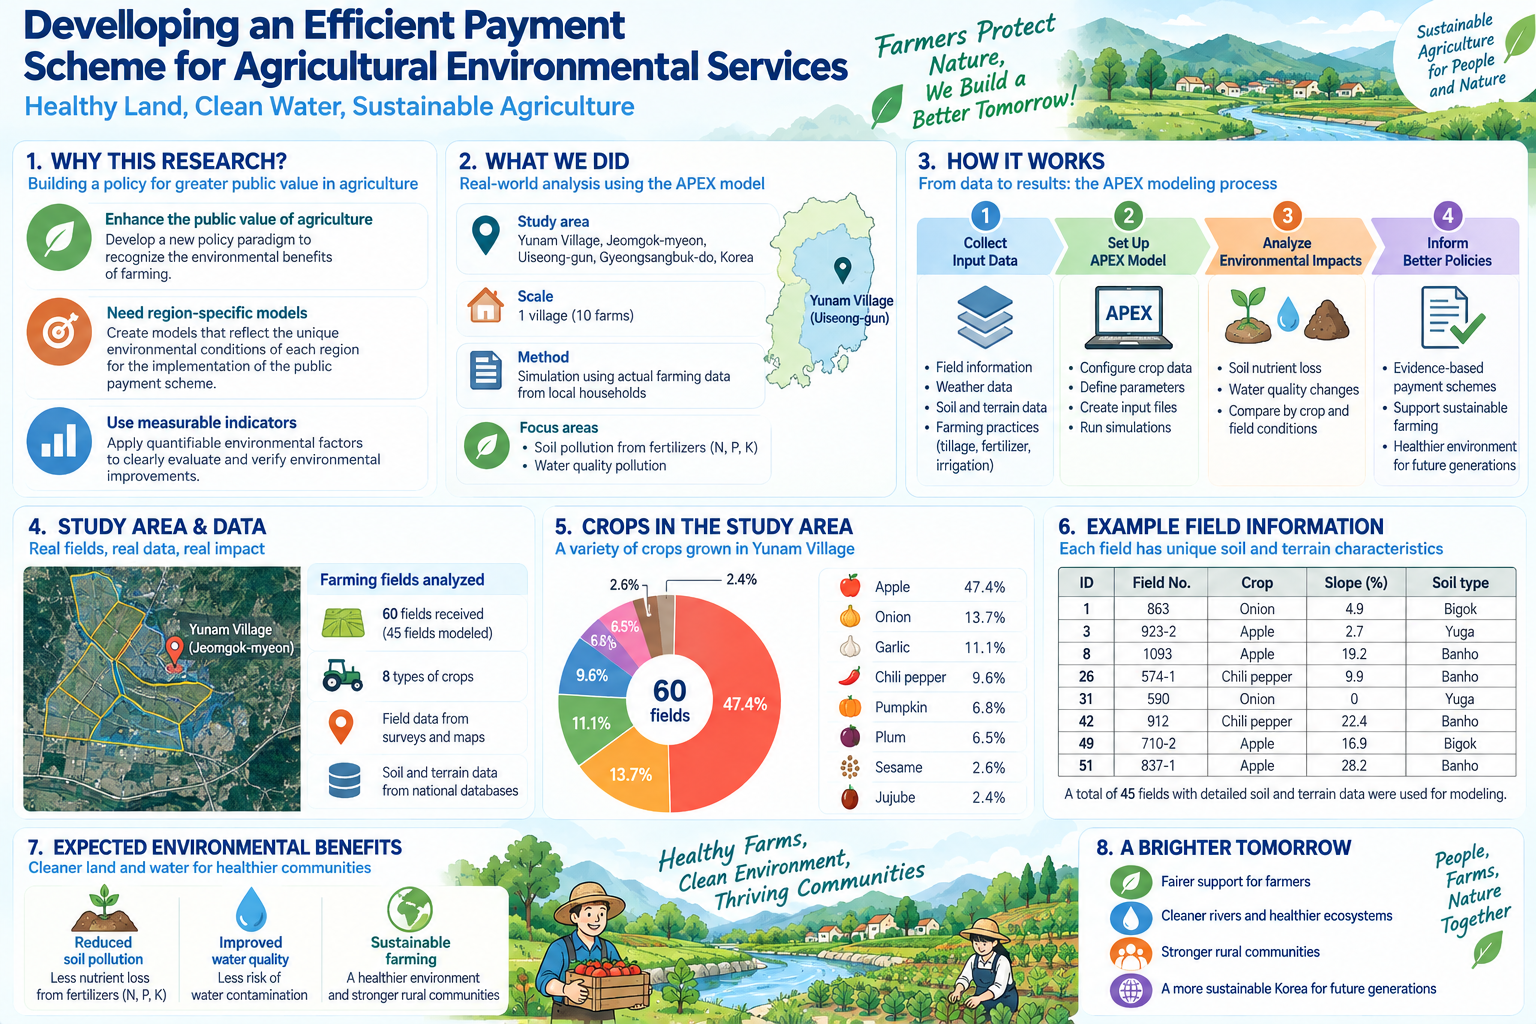
APEX Modelling for an Environmental Service Direct Payment Scheme
In 2020 the Institute of Watershed Management (IWMI) carried out a study on an efficient environmental service direct payment model, commiss…
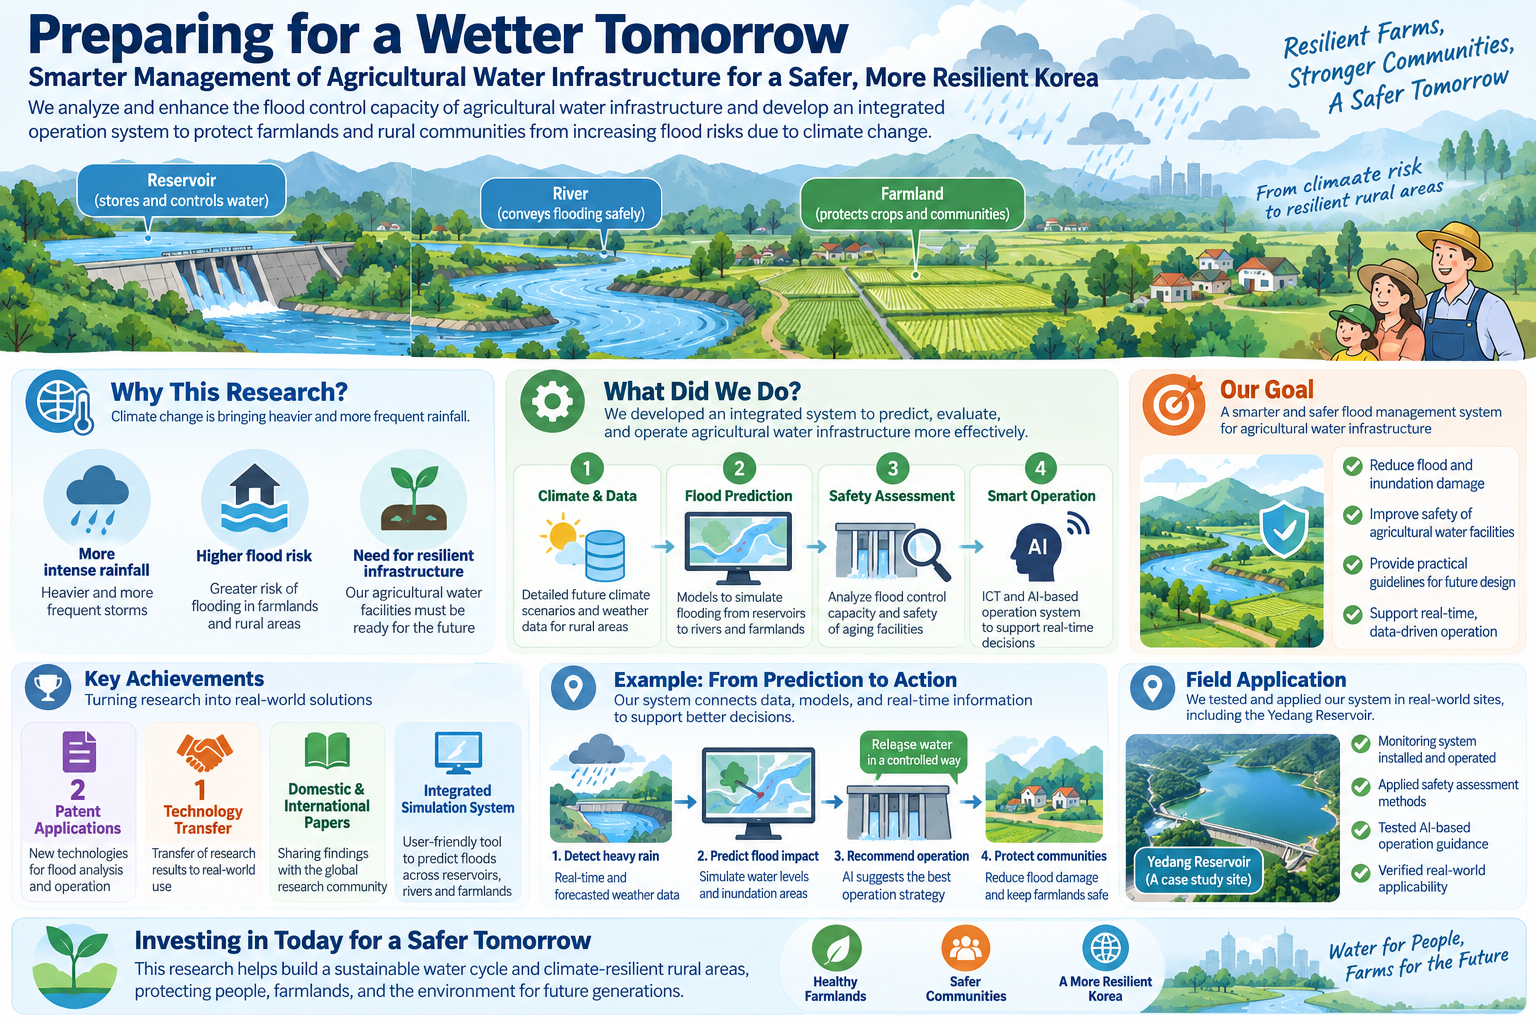
Flood Control Capacity Analysis and Integrated Operation of Agricultural Hydraulic Structures under Climate Change
The Institute of Watershed Management (IWMI) took part as a joint research institution in "Flood Control Capacity Analysis and Integrated Op…
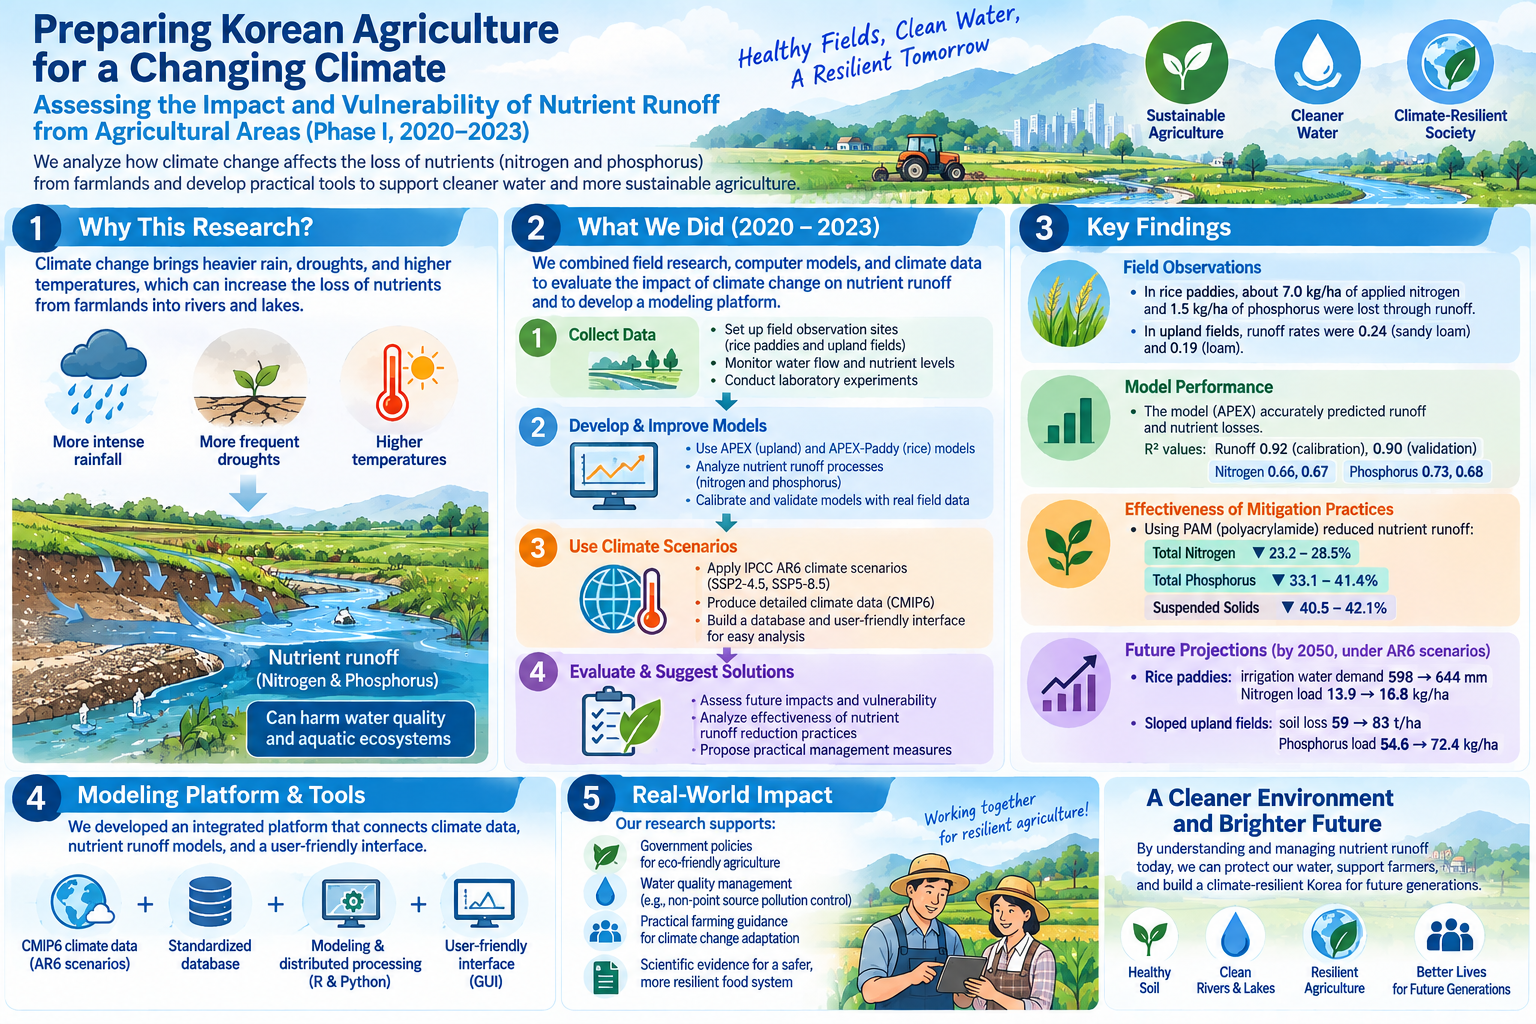
Impact and Vulnerability Assessment of Nutrient Discharge from Farmland under Climate Change
The Institute of Watershed Management (IWMI) took part as a joint research institution in Phase I of a project assessing the impact of clima…
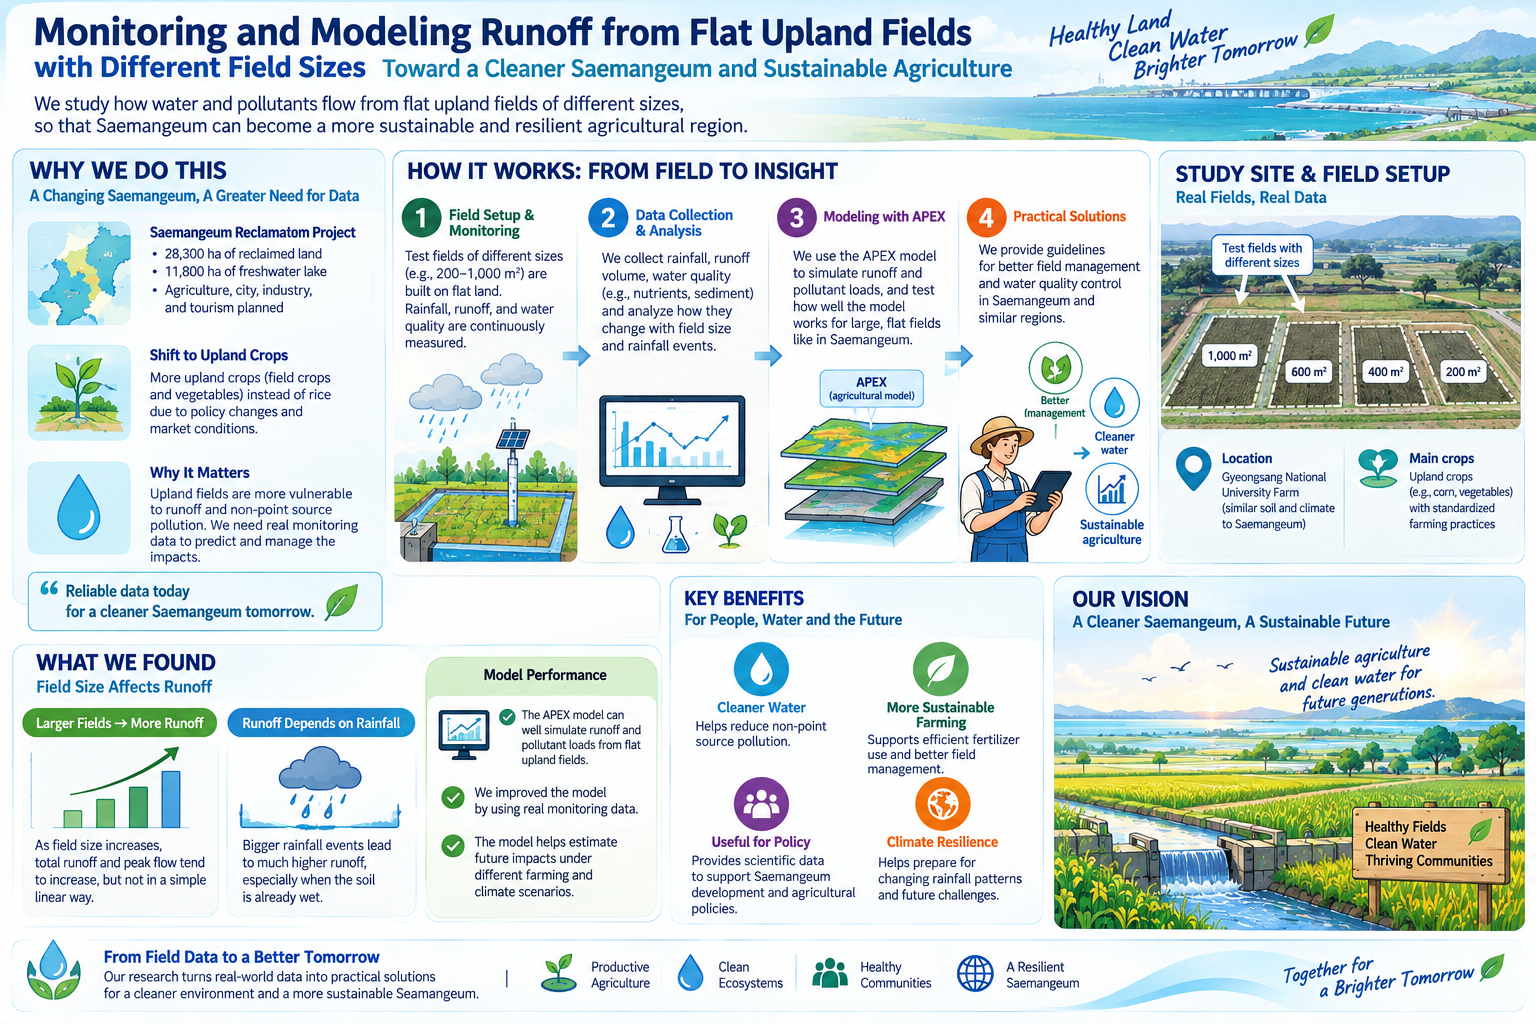
Monitoring and Modelling Discharge from Flat Upland Fields at Different Scales
The Institute of Watershed Management (IWMI) contributed to a study on monitoring and modelling discharge from flat upland fields at differe…
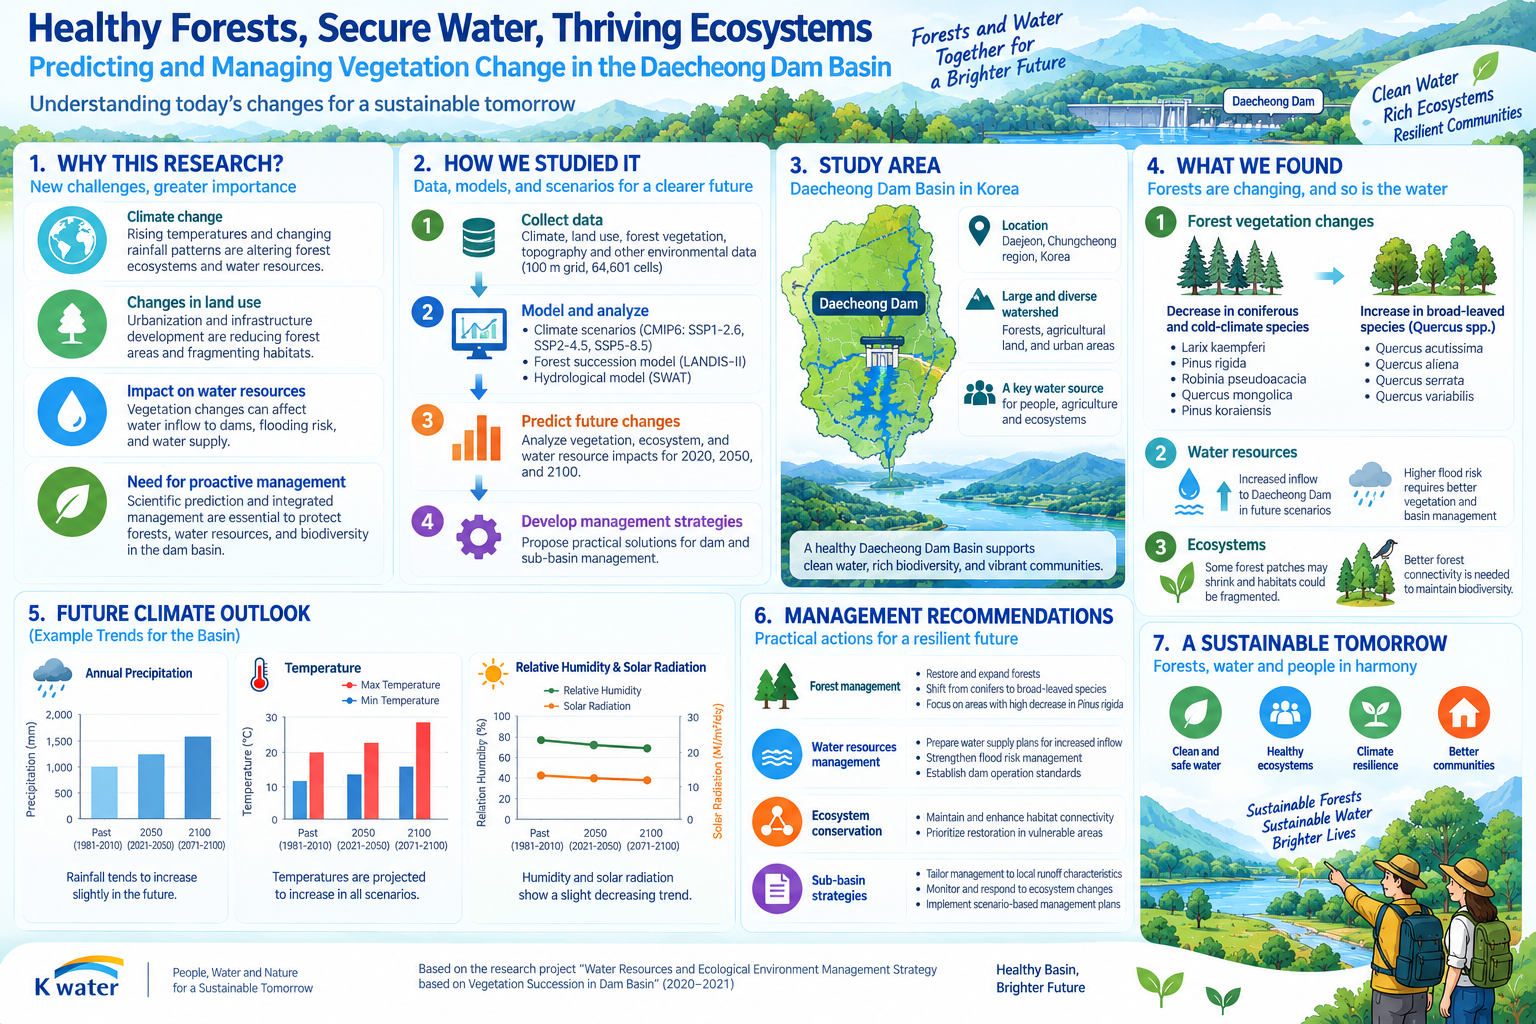
Predicting Ecological and Water Resource Impacts of Vegetation Succession in Dam Watersheds
The Institute of Watershed Management (IWMI) carried out a study for K-water on predicting the ecological and water resource impacts of vege…
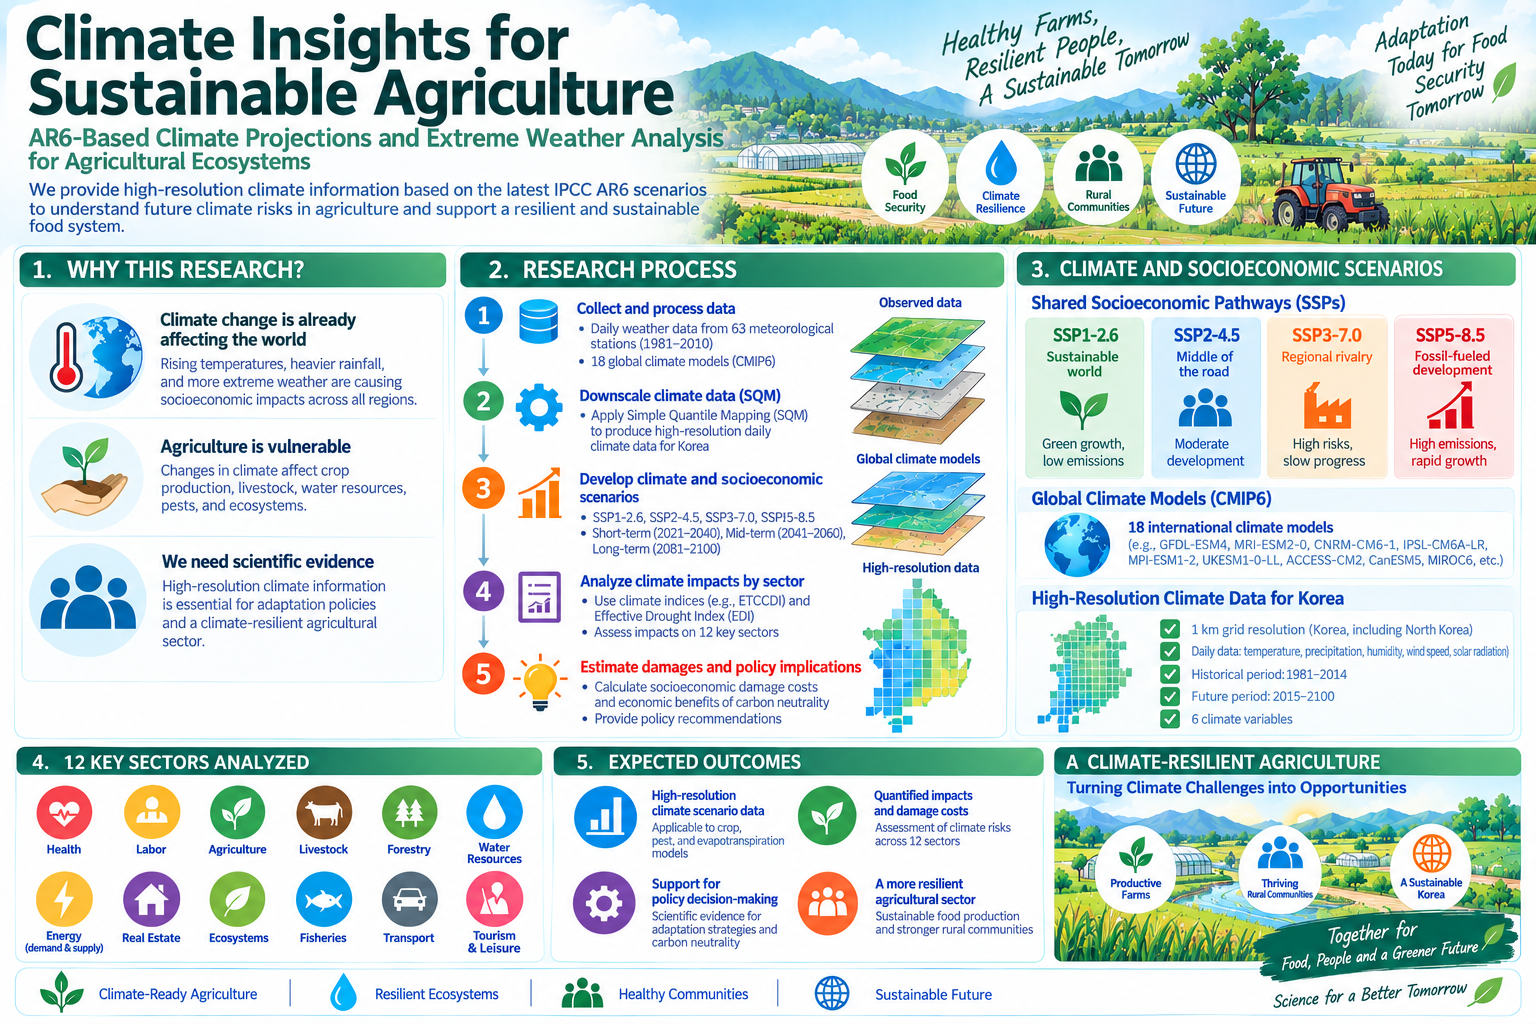
Analysis and Information Production for Agro-Ecosystem Climate and Extreme Weather Based on AR6 Projections
The Institute of Watershed Management (IWMI) participated in a study analysing agro-ecosystem climate and extreme weather based on IPCC AR6 …
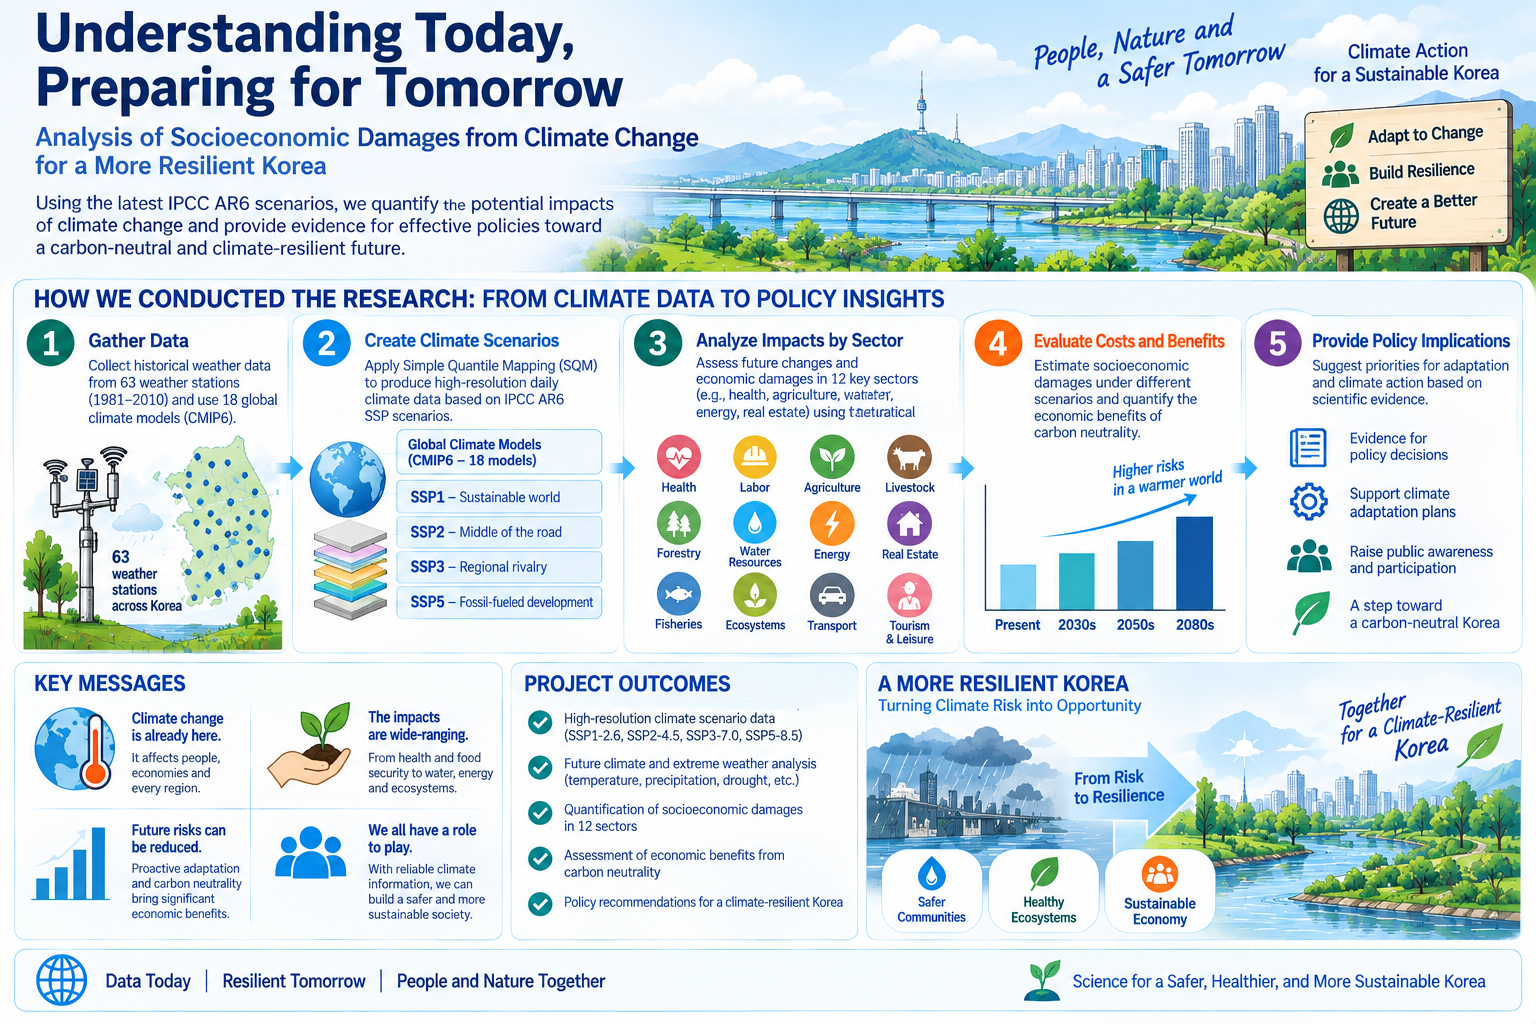
Analysis of Sector-Specific Socio-Economic Damage Costs of Climate Change
The Institute of Watershed Management (IWMI) contributed to a study for the Ministry of Environment on sector-specific socio-economic damage…
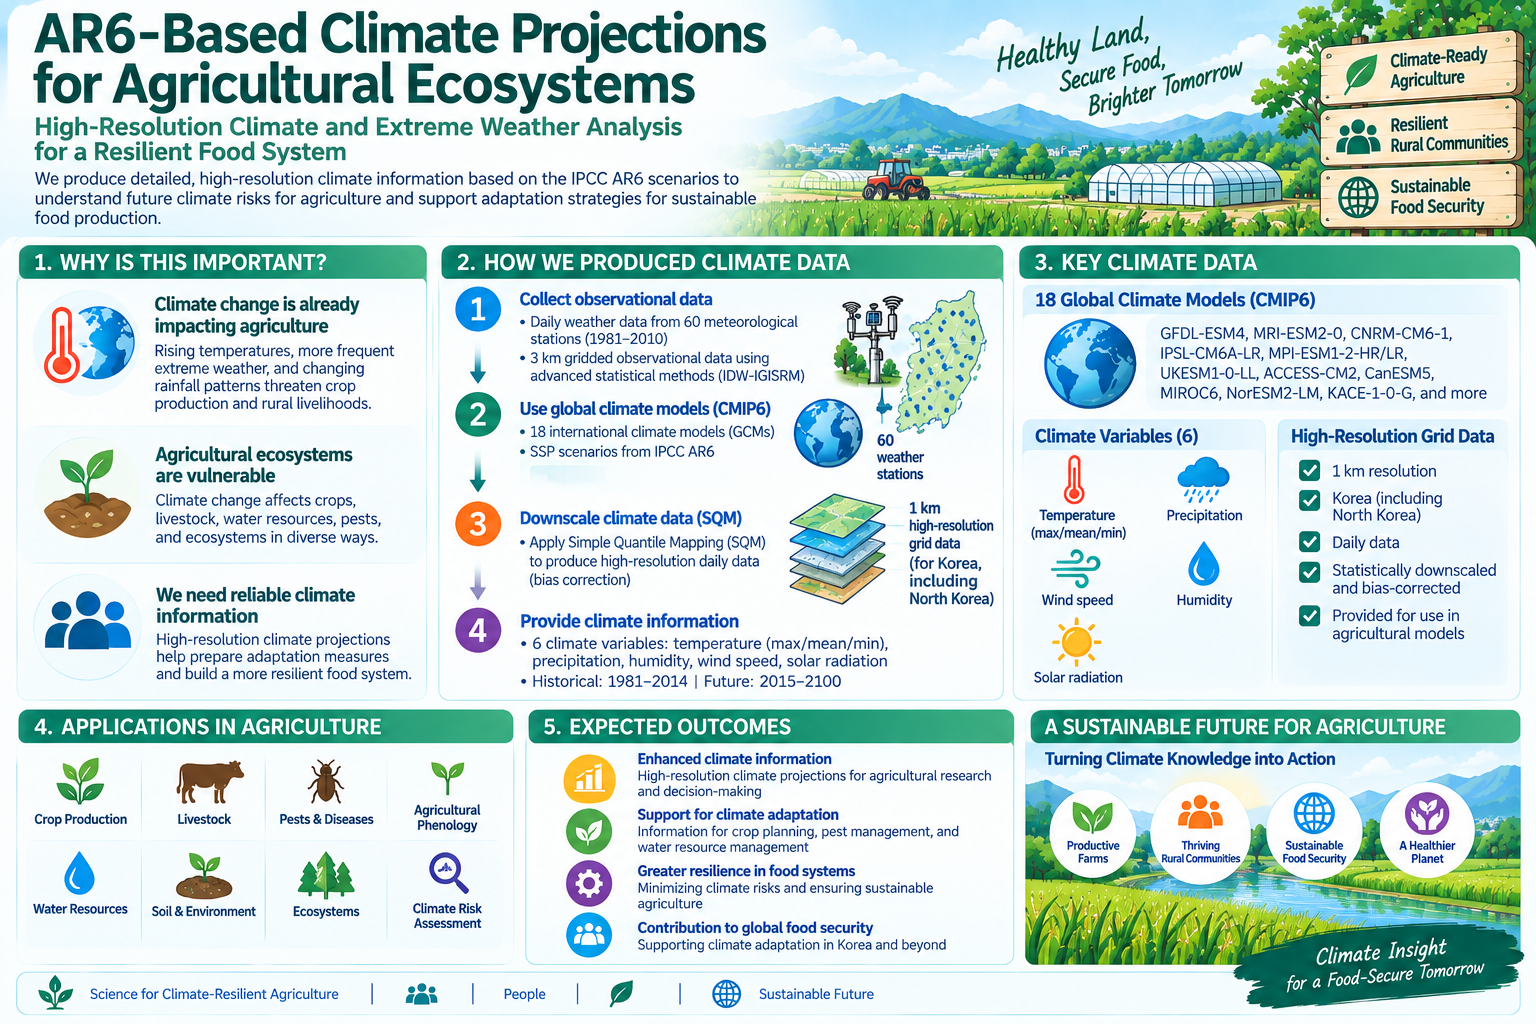
Climate Impact and Vulnerability Assessment for Agro-Environmental Ecosystems: Scenario Downscaling and Future Projections
In 2021 the Institute of Watershed Management (IWMI) produced the climate change scenario downscaling and future climate projection componen…
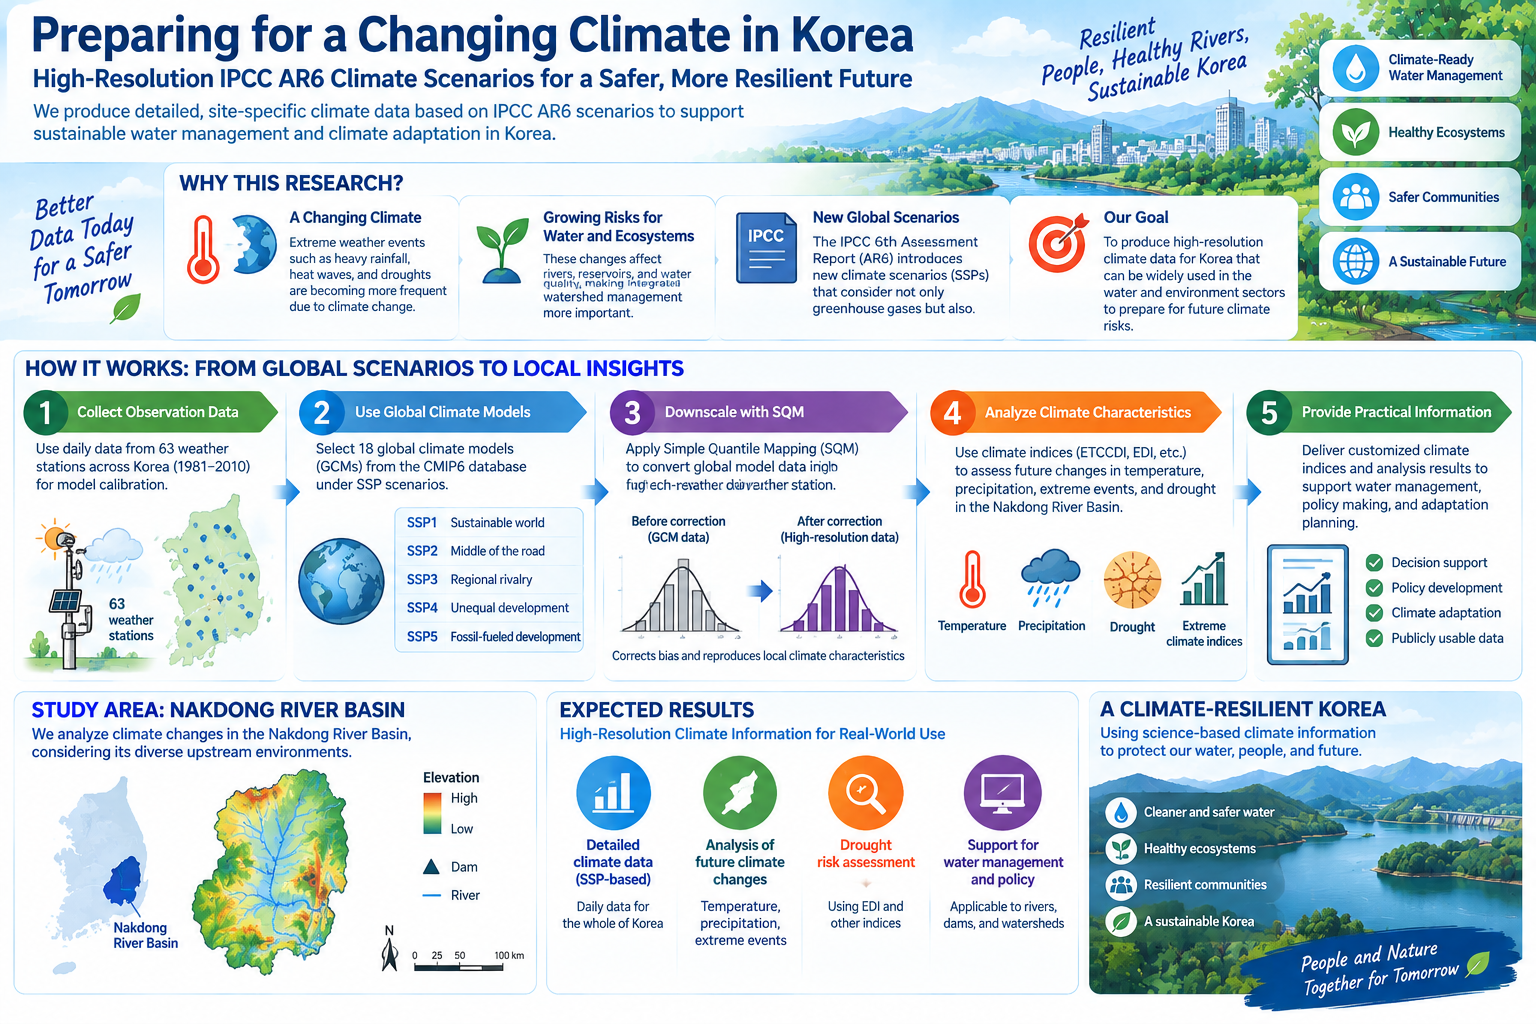
Downscaled Climate Change Scenario Data Based on IPCC AR6
The Institute of Watershed Management (IWMI) produced downscaled climate change scenario data based on the IPCC Sixth Assessment Report, und…
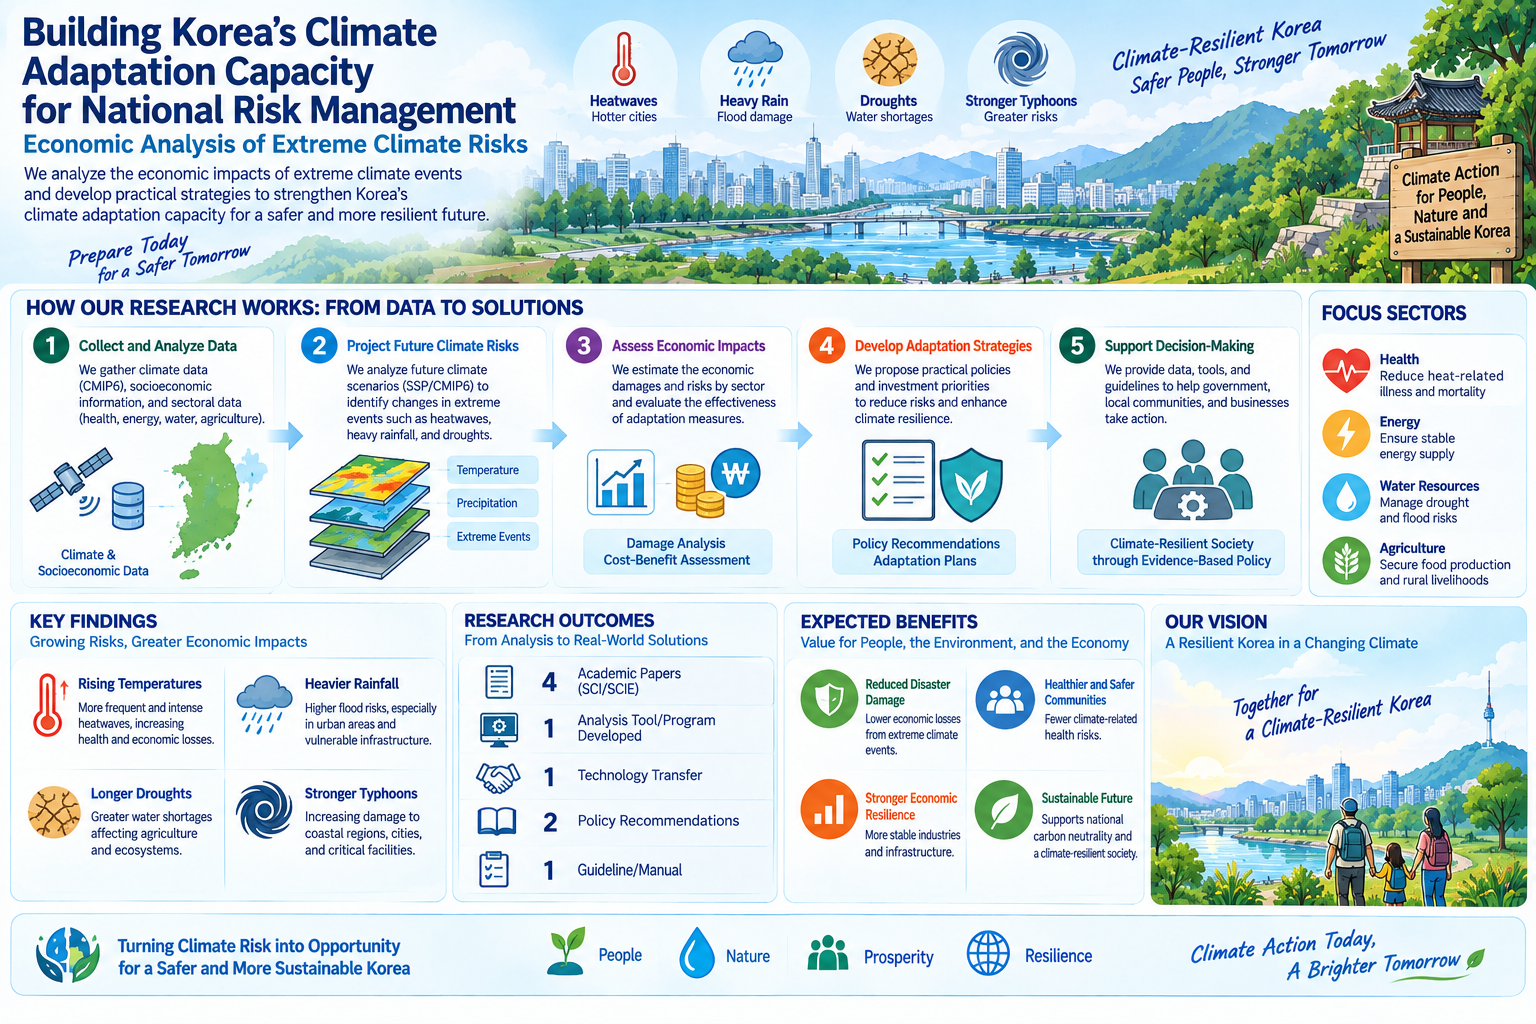
Downscaled Extreme Weather Data under SSP-RCP Scenarios for National Risk Management
The Institute of Watershed Management (IWMI) produced downscaled extreme weather data under SSP and RCP scenarios under contract to the Kore…
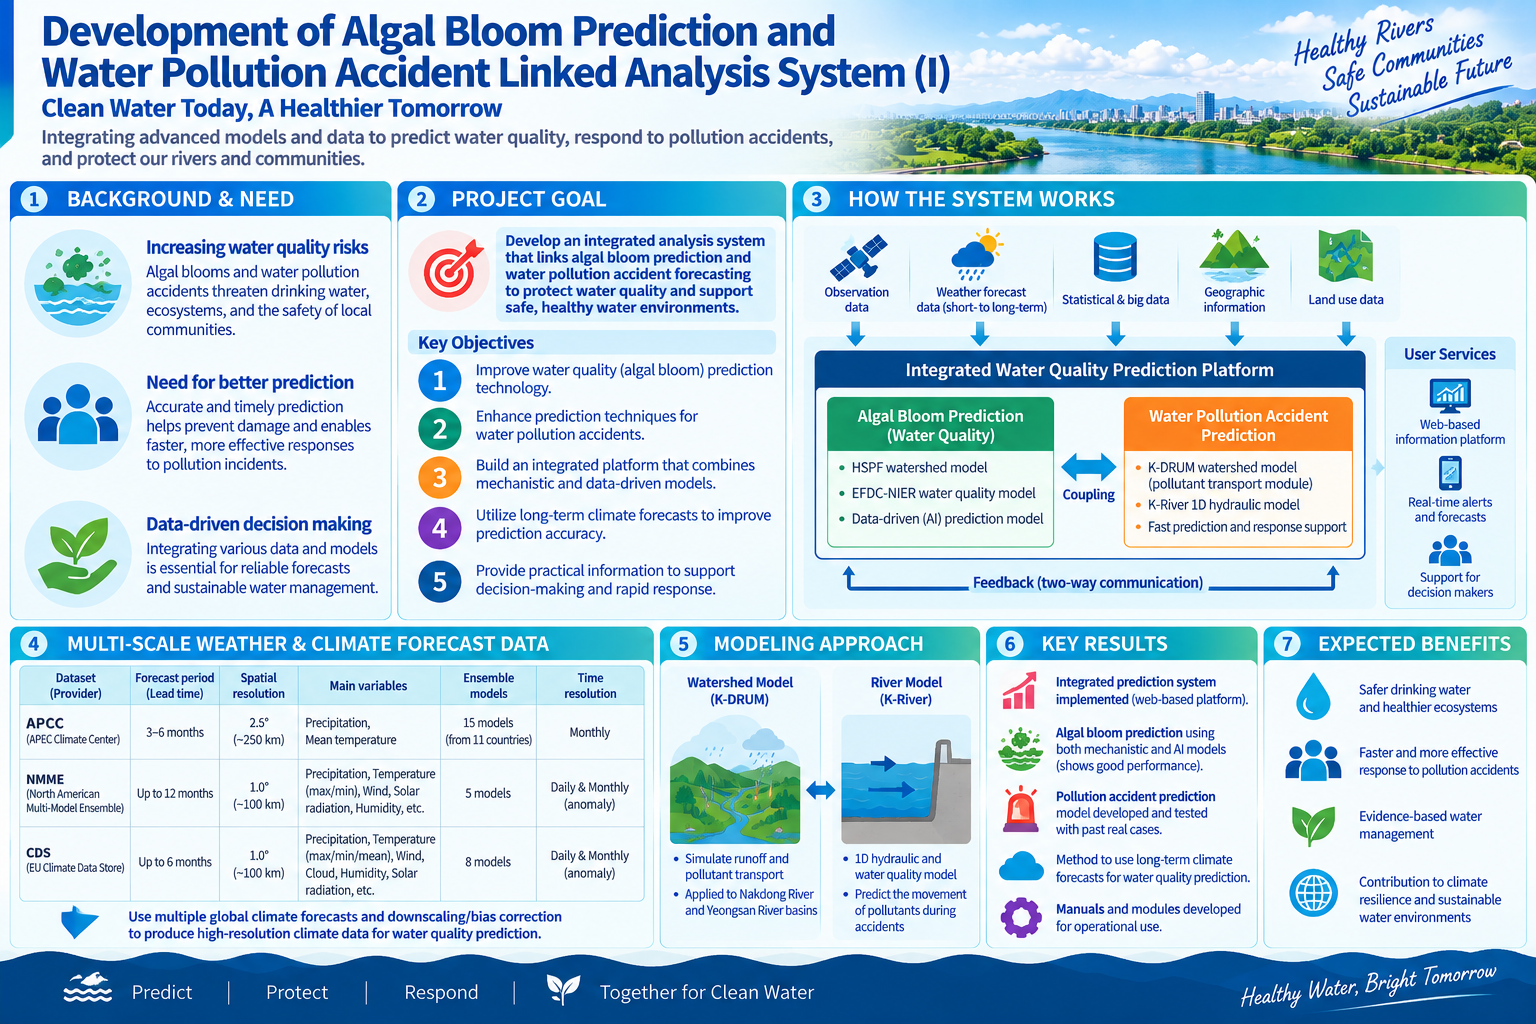
Linking Algal Bloom Forecasting with Water Pollution Incident Response Using Long-Range Weather Outlooks
The Institute of Watershed Management (IWMI) took part as a subcontracted institution in a study for the National Institute of Environmental…
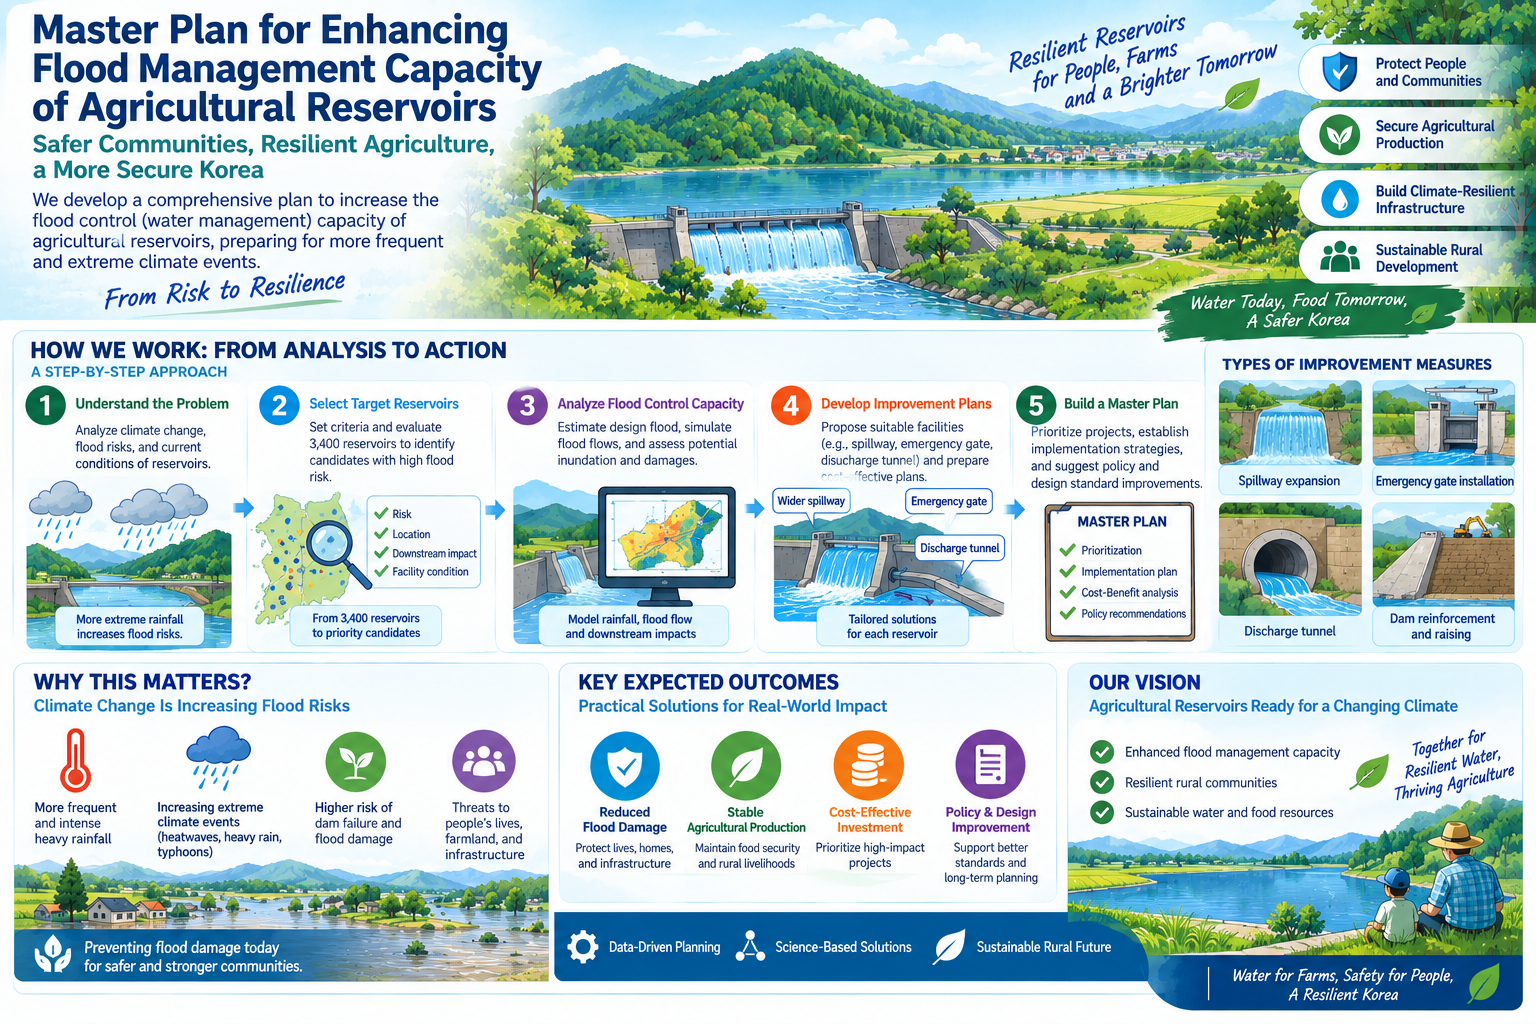
Master Plan for Expanding Flood Control Capacity of Agricultural Reservoirs
The Institute of Watershed Management (IWMI) took part in a study to establish a master plan for expanding the flood control capacity of agr…
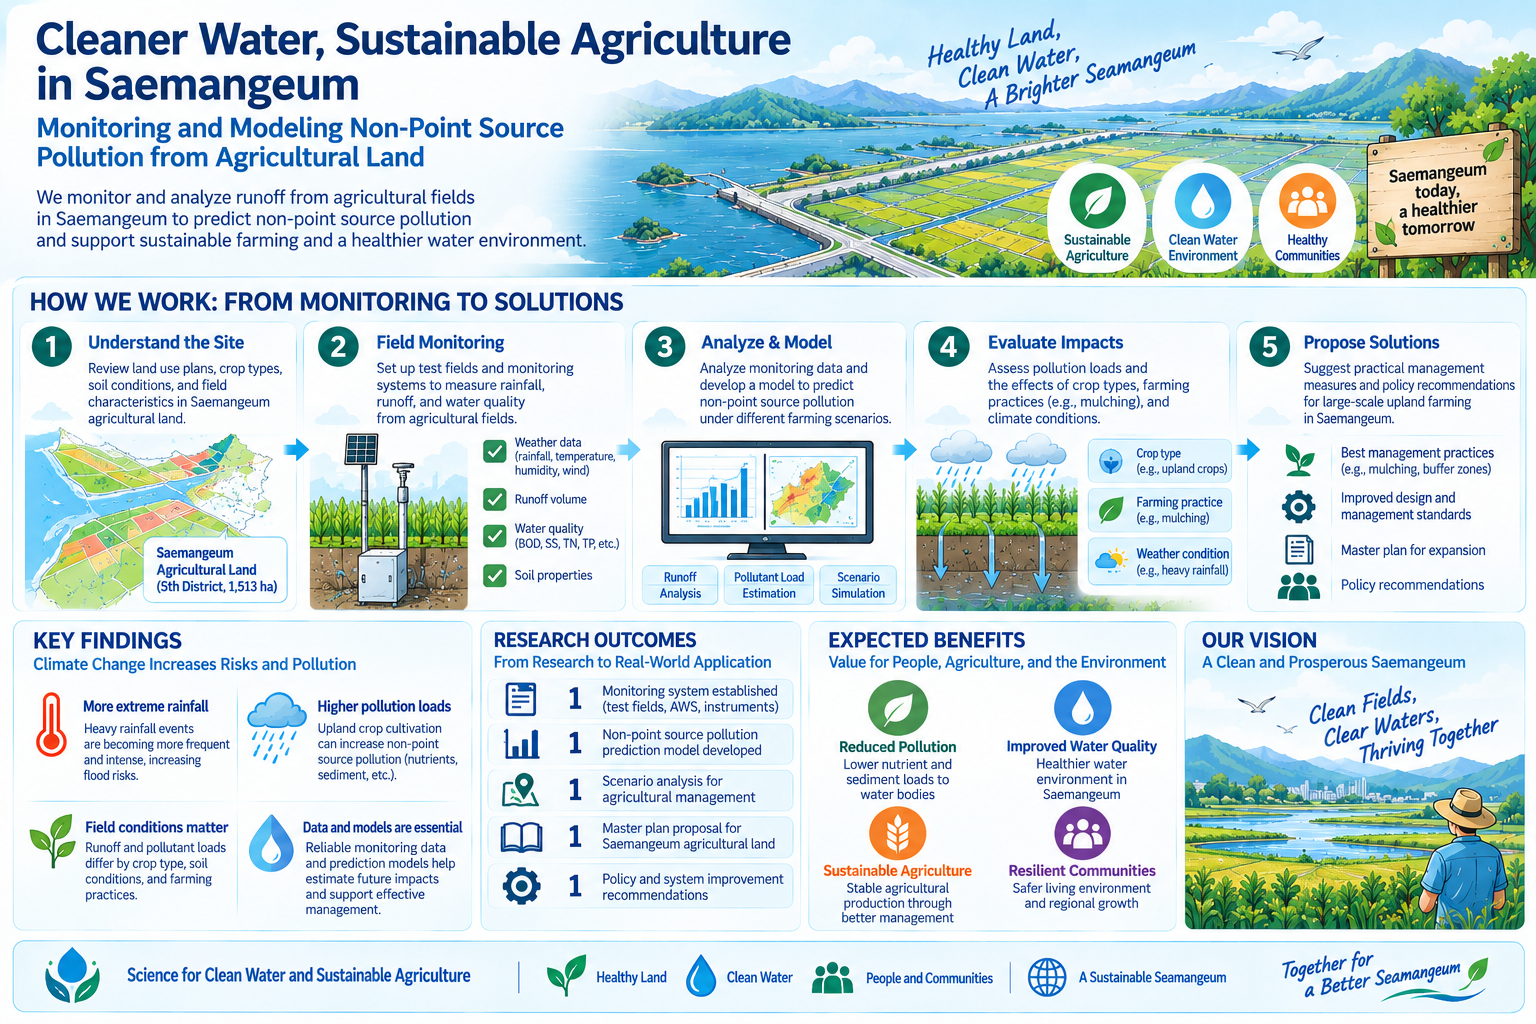
Monitoring and Modelling Non-Point Source Discharge from Saemangeum Agricultural Land
The Institute of Watershed Management (IWMI) participated as a joint research institution in a study monitoring and modelling non-point sour…
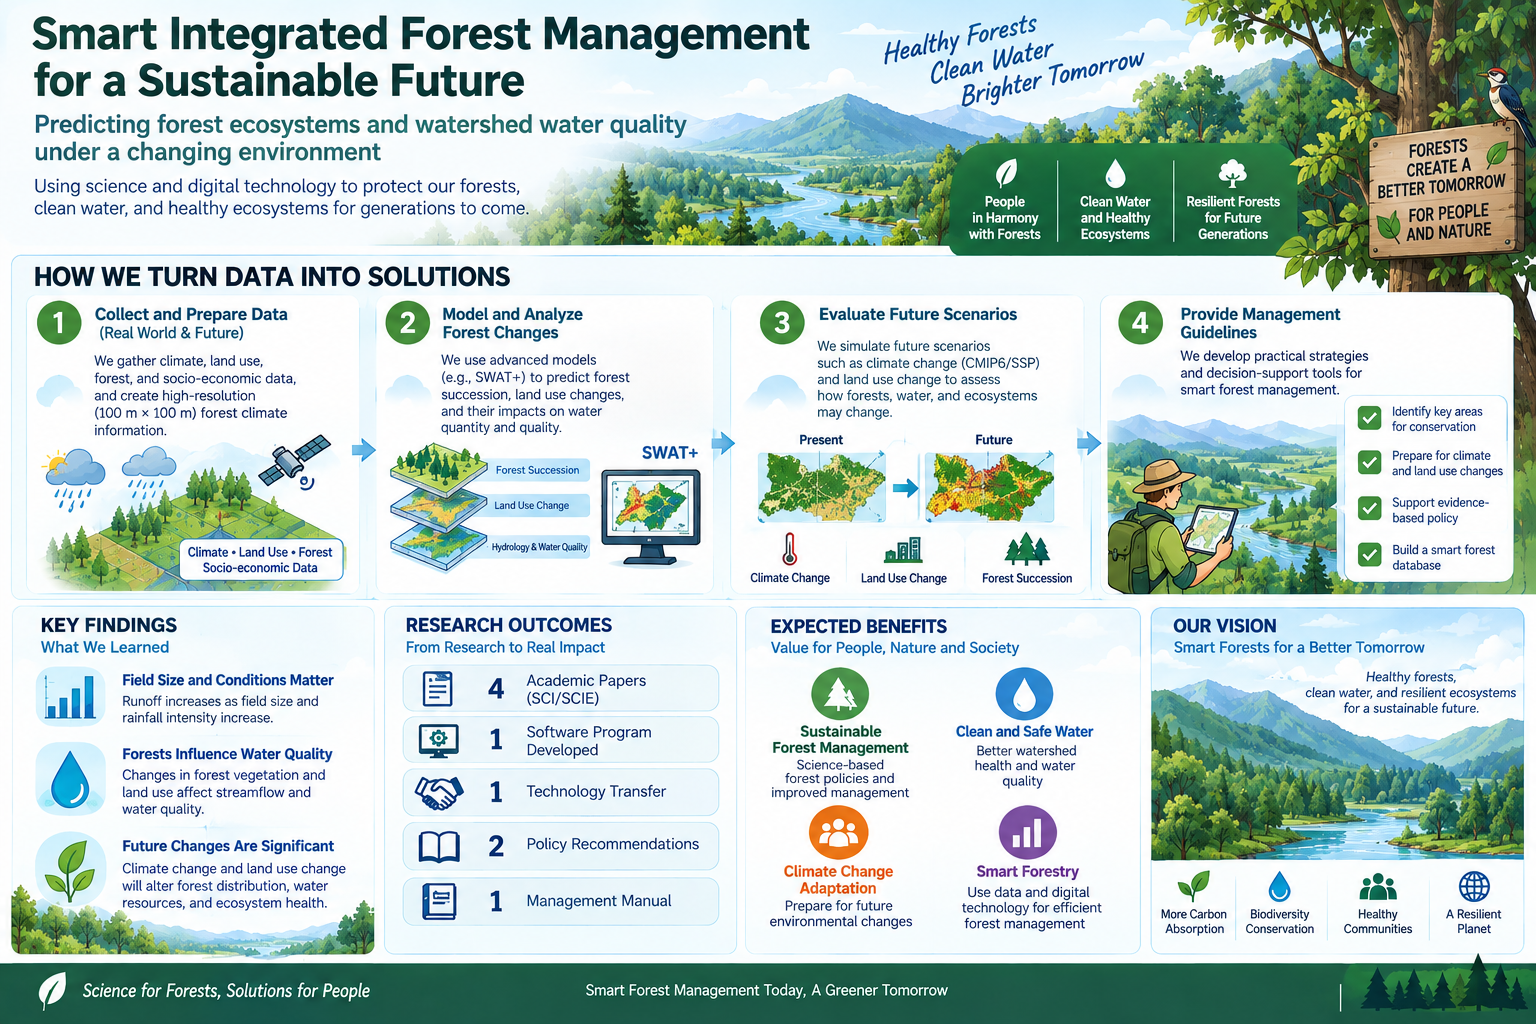
Smart Integrated Forest Resource Management under Environmental Change
The Institute of Watershed Management (IWMI) took part in a research project on smart integrated forest resource management through predicti…
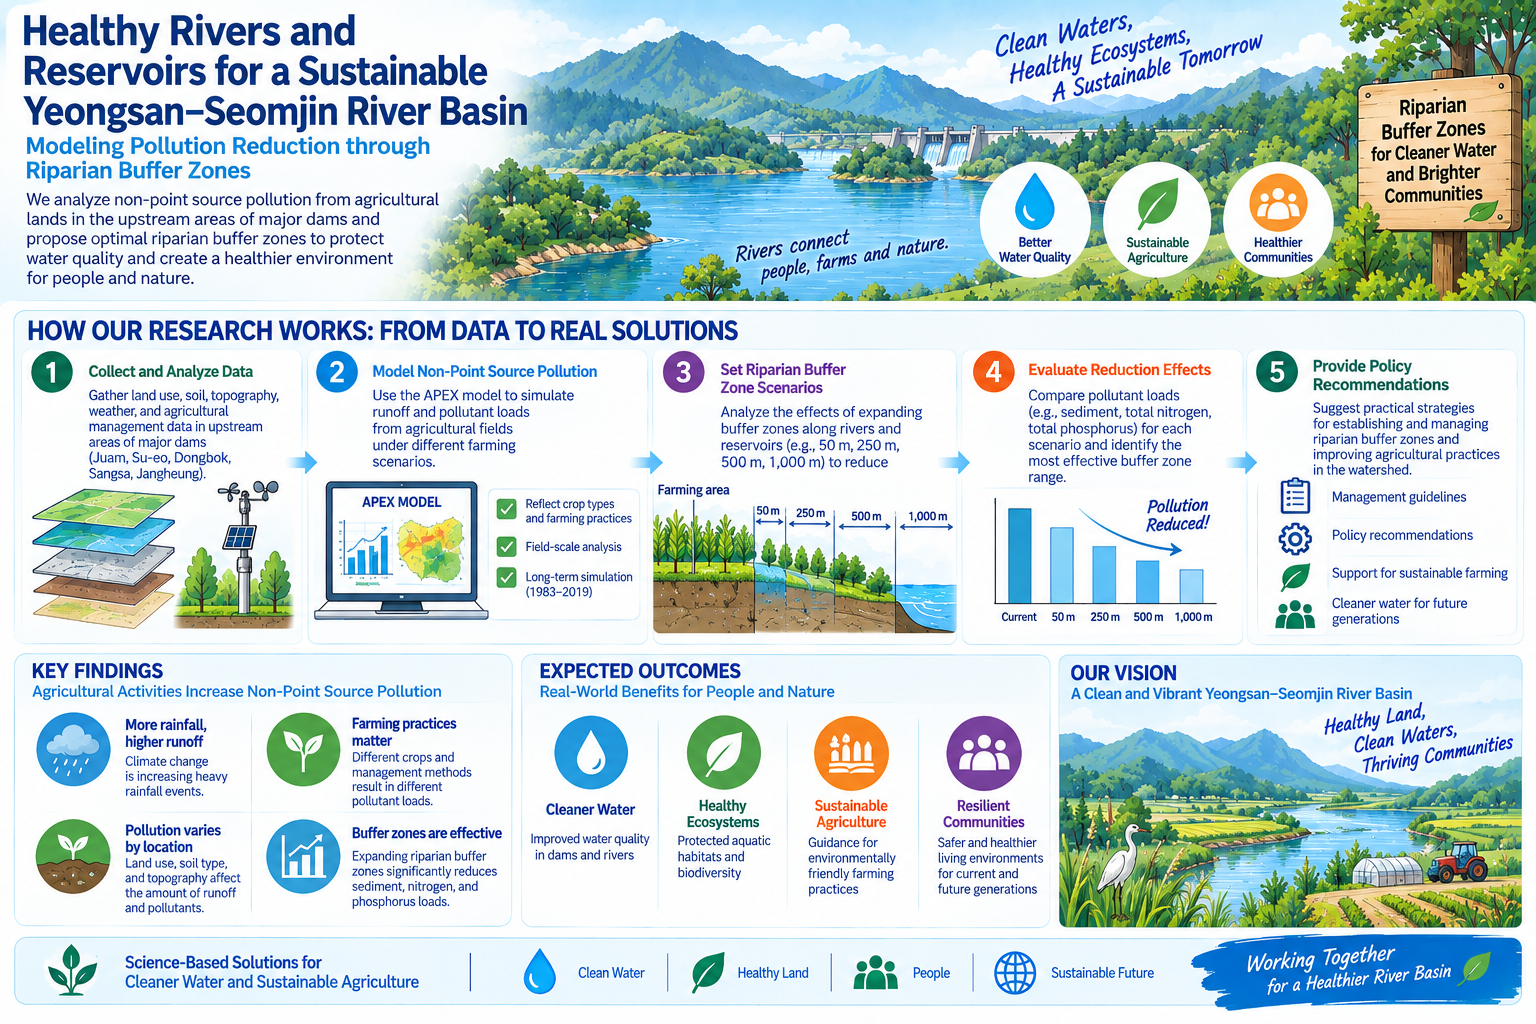
SWAT Modelling of Riparian Buffer Zones in the Yeongsan and Seomjin River Basins
The Institute of Watershed Management (IWMI) carried out SWAT modelling for the analysis of riparian buffer zone effects, as a subcontract t…
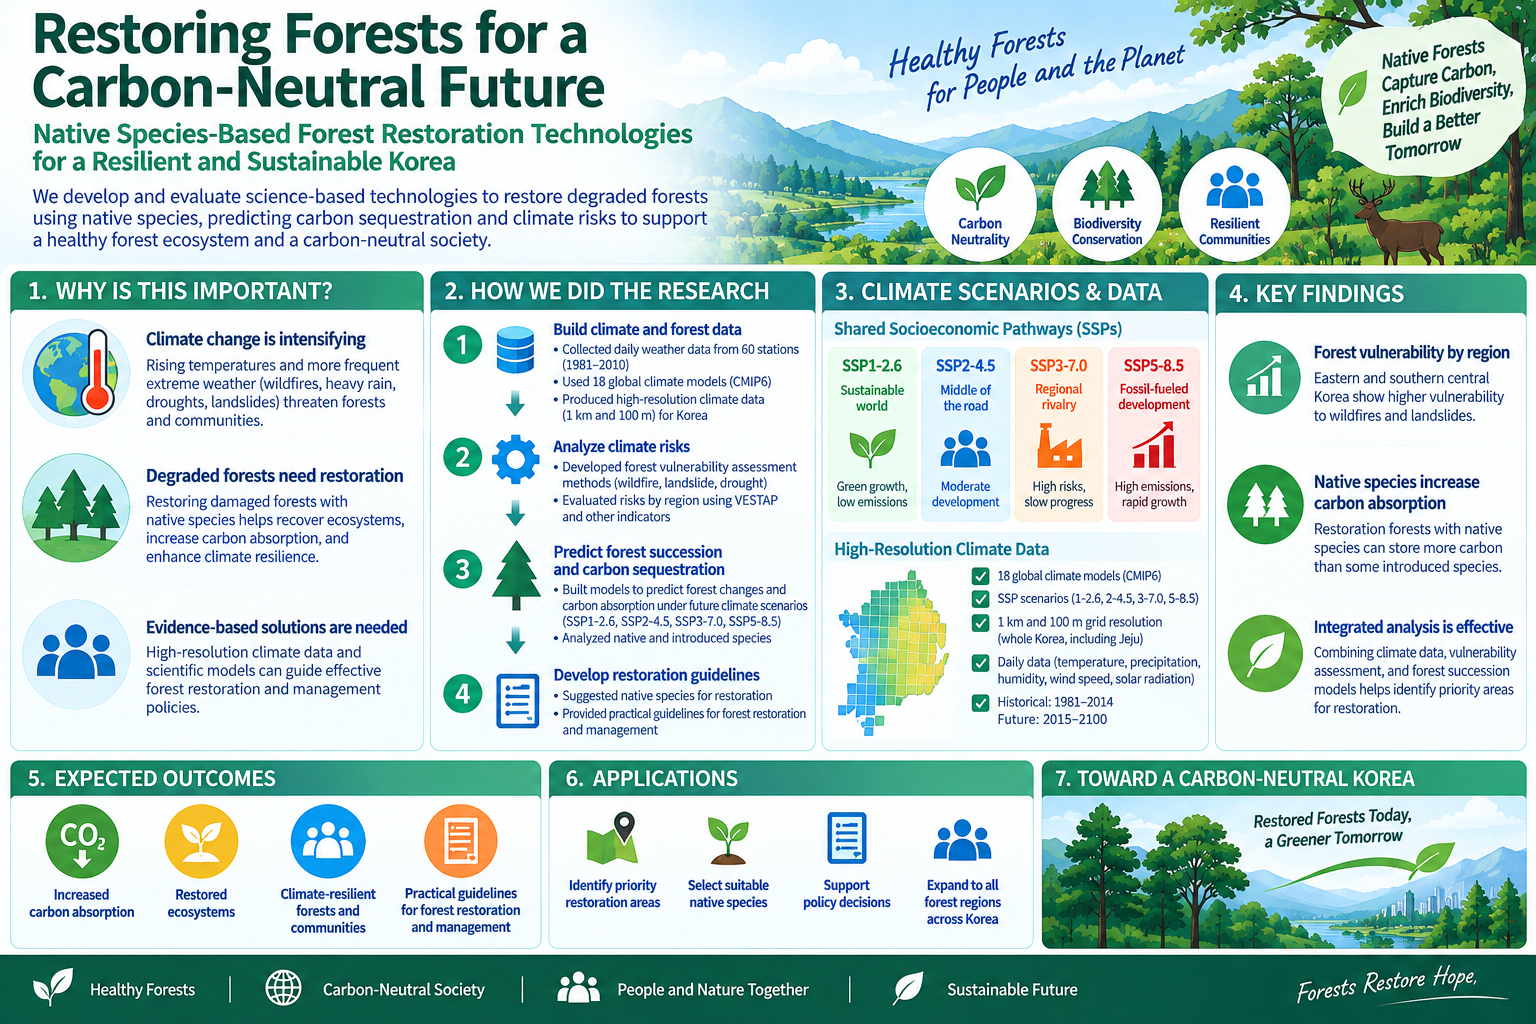
Carbon-Neutral Forest Restoration Using Native Species: Mountain Climate Downscaling
The Institute of Watershed Management (IWMI) contributed mountain climate change downscaling to a research project on carbon-neutral forest …
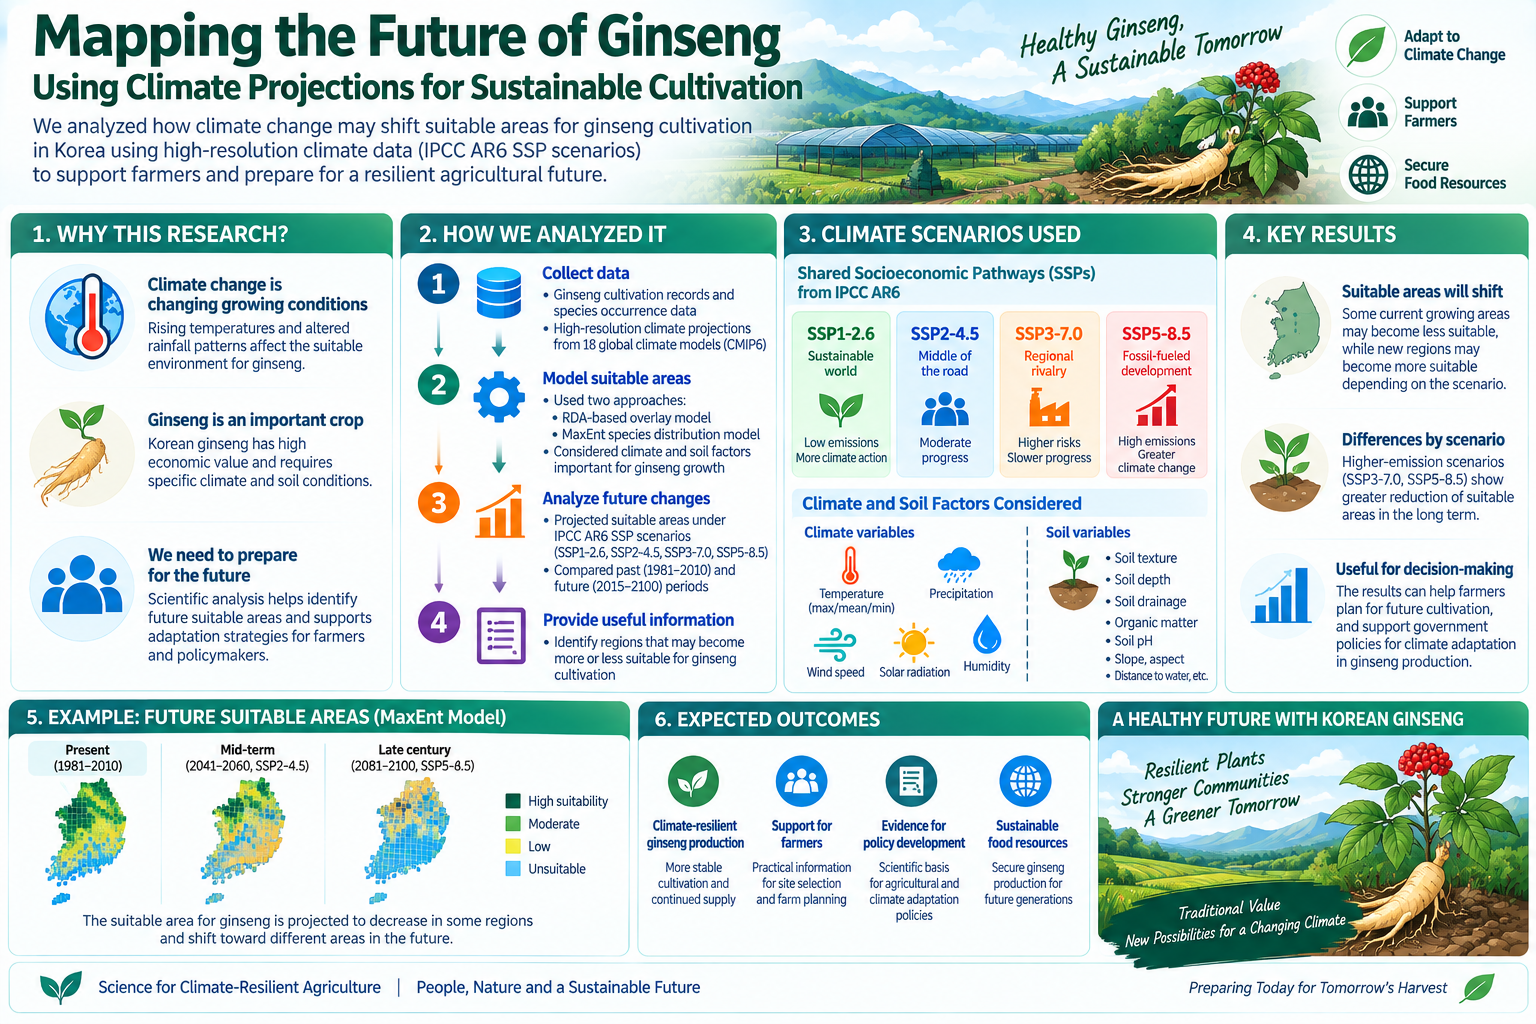
Change in Ginseng Cultivation Suitability Using 1 km Downscaled SSP Data
The Institute of Watershed Management (IWMI) analysed changes in ginseng cultivation suitability using 1 km downscaled SSP data, under contr…
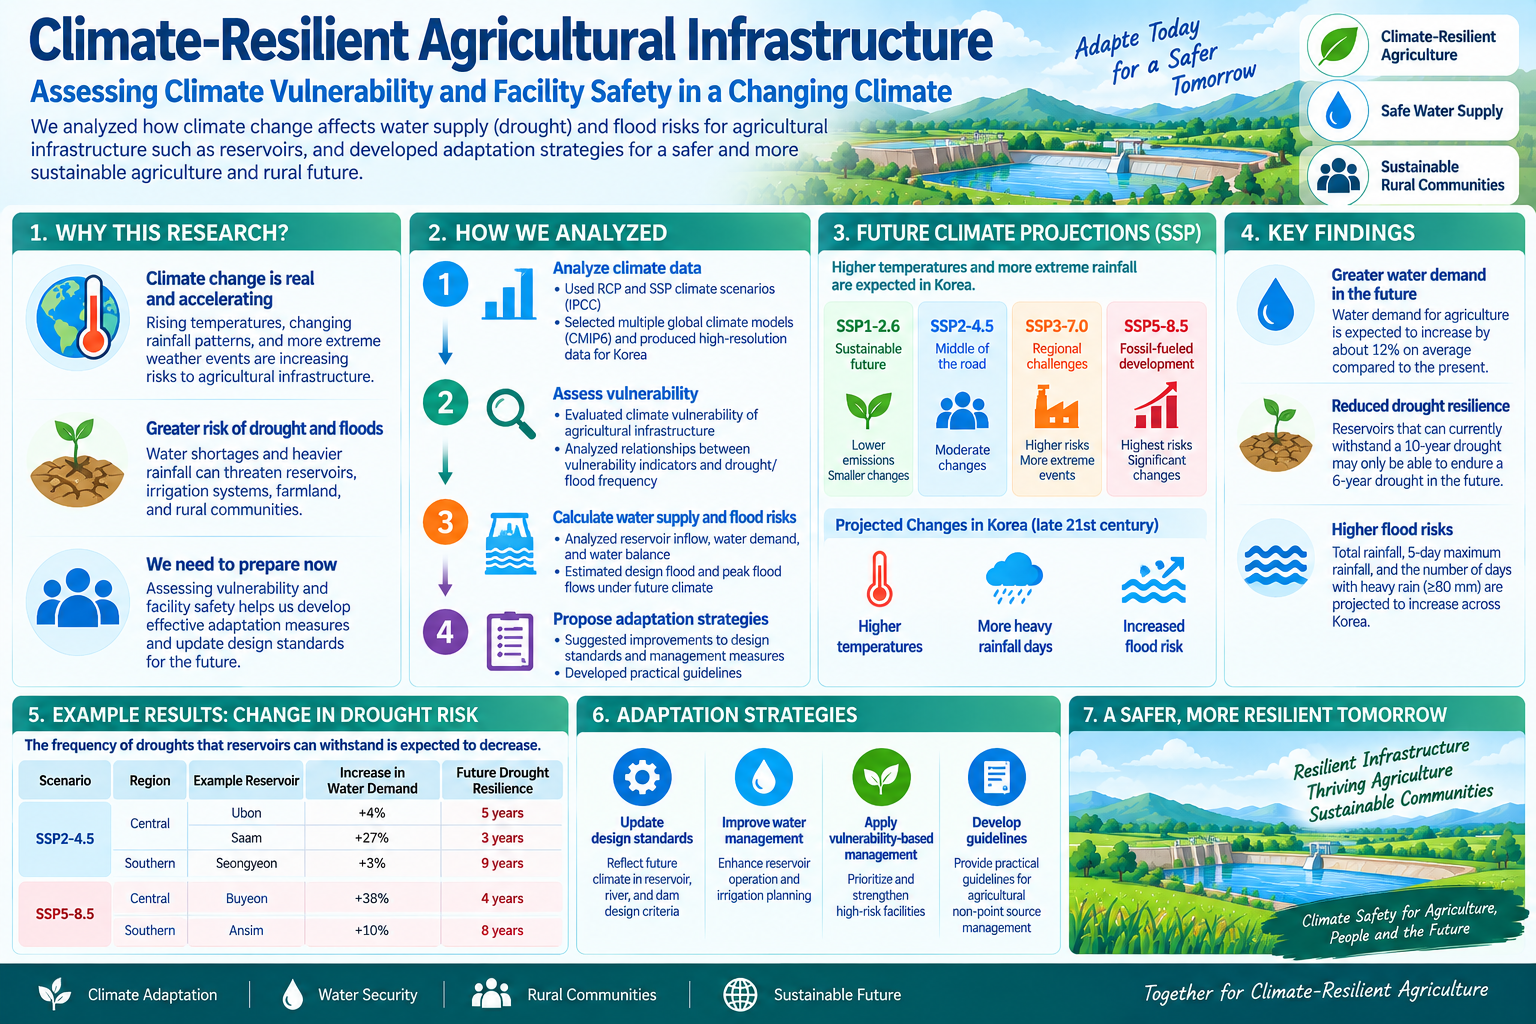
Climate Safety Assessment of Vulnerable Facilities Based on Climate Vulnerability Analysis
The Institute of Watershed Management (IWMI) took part in a study analysing the climate safety of vulnerable facilities based on climate cha…
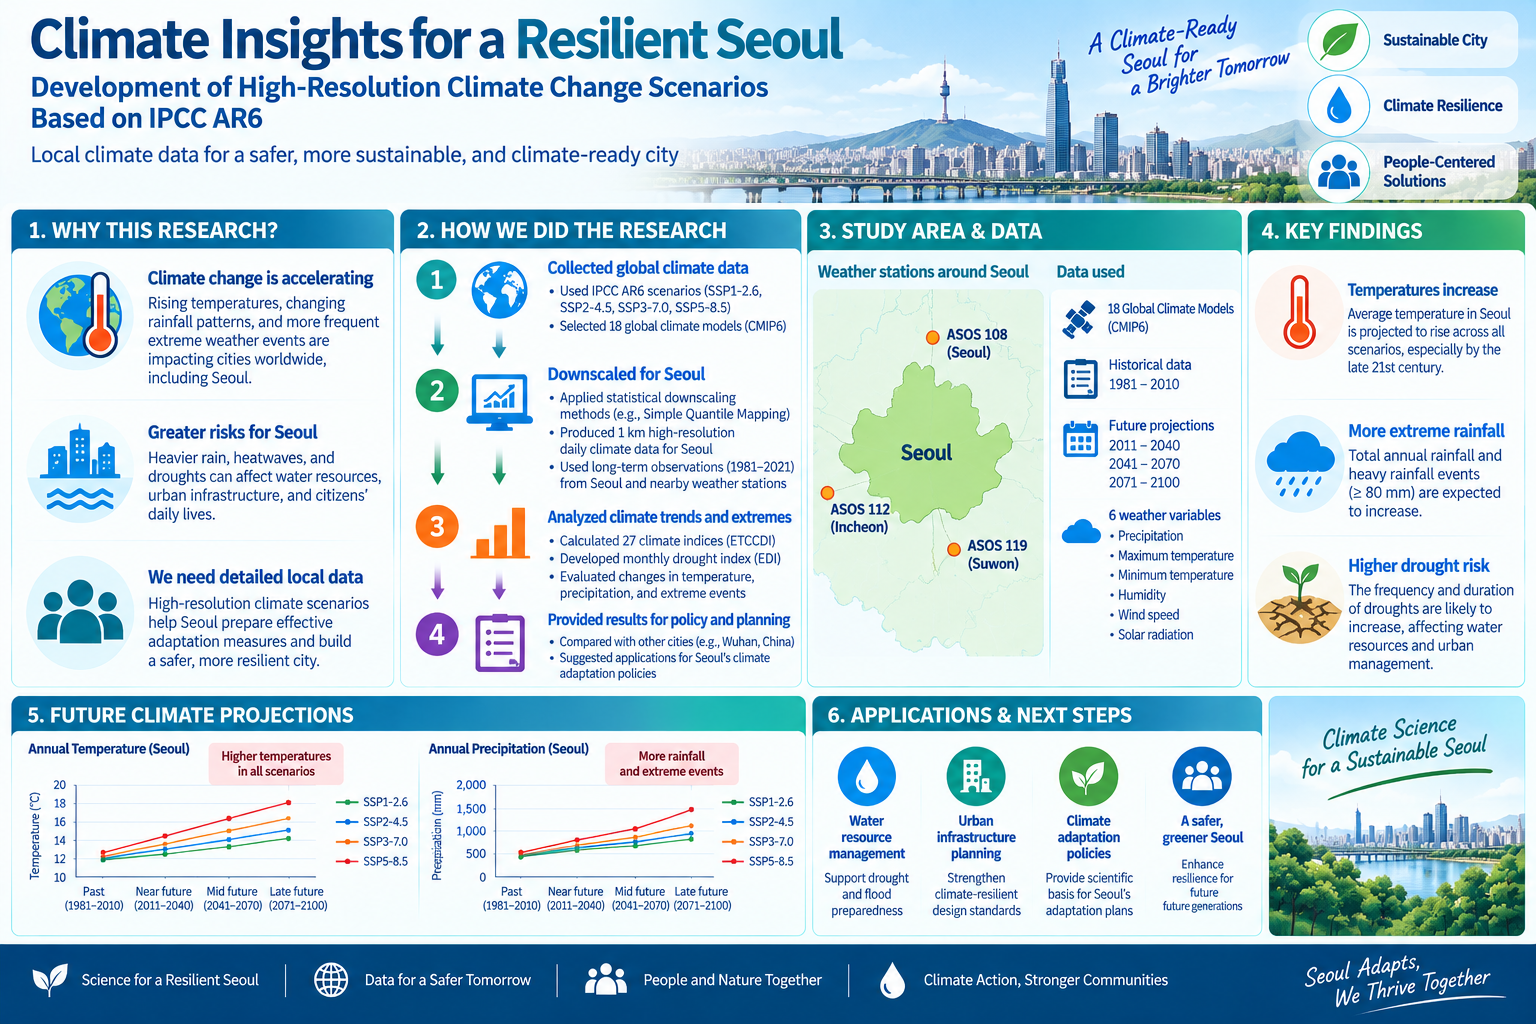
Downscaling AR6 Climate Change Scenarios for Seoul
The Institute of Watershed Management (IWMI) developed downscaled climate change scenarios for Seoul based on the IPCC Sixth Assessment Repo…
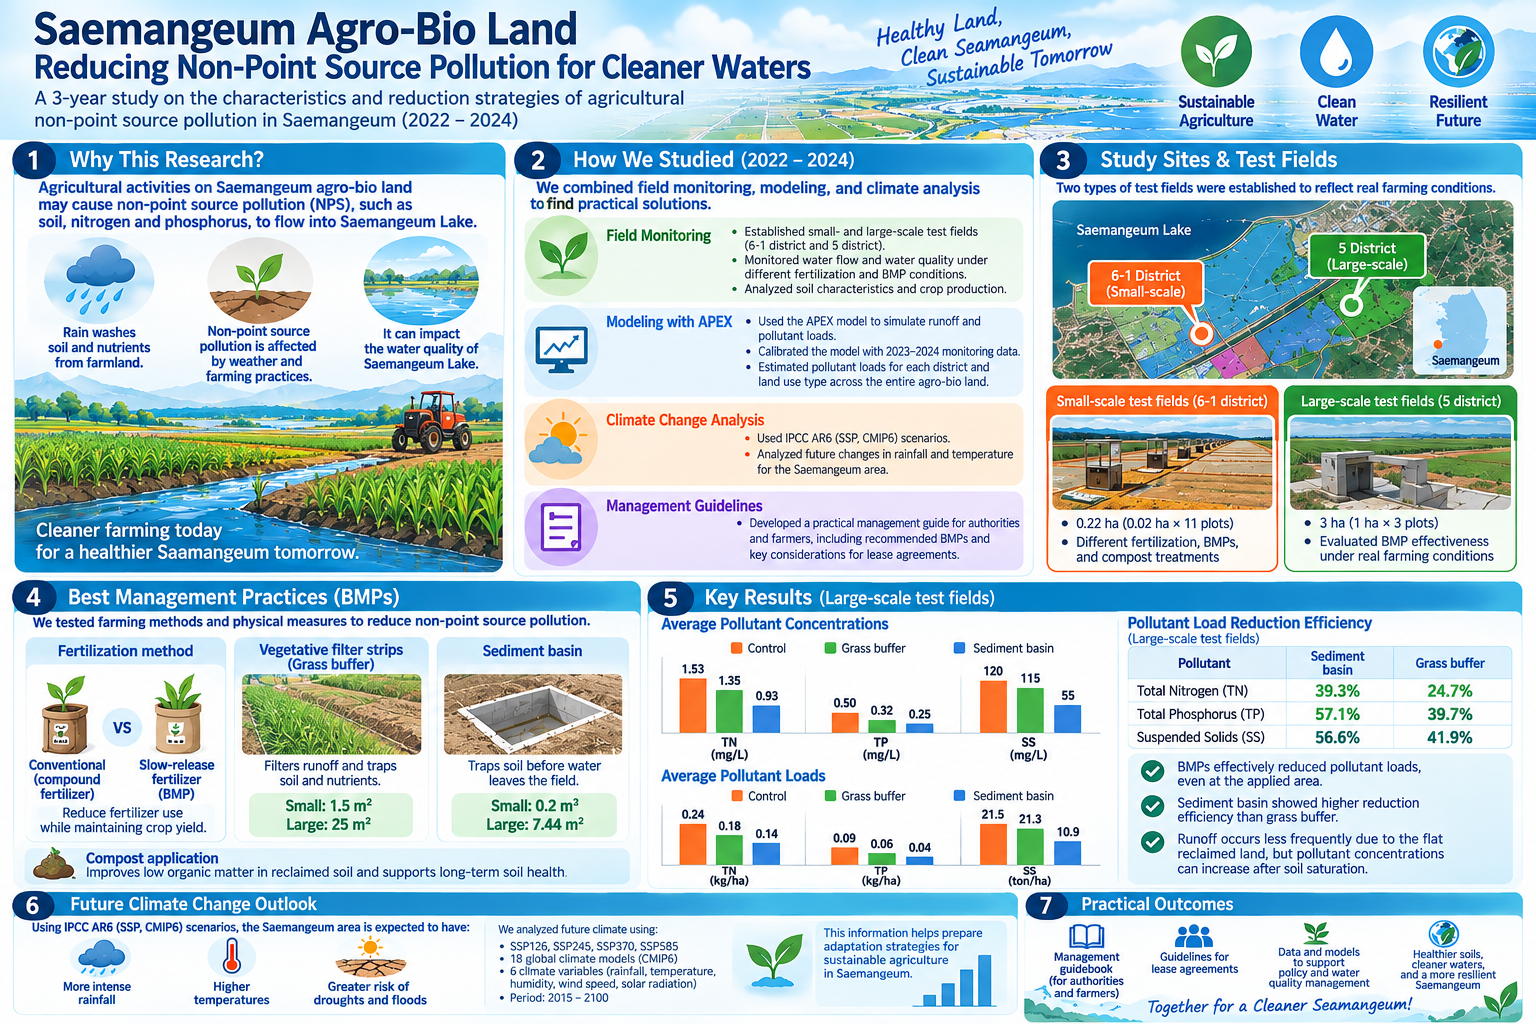
Non-Point Source Discharge Characteristics and Reduction Measures for Saemangeum Agricultural Land
The Institute of Watershed Management (IWMI) conducted a study on non-point source discharge characteristics and reduction measures for the …
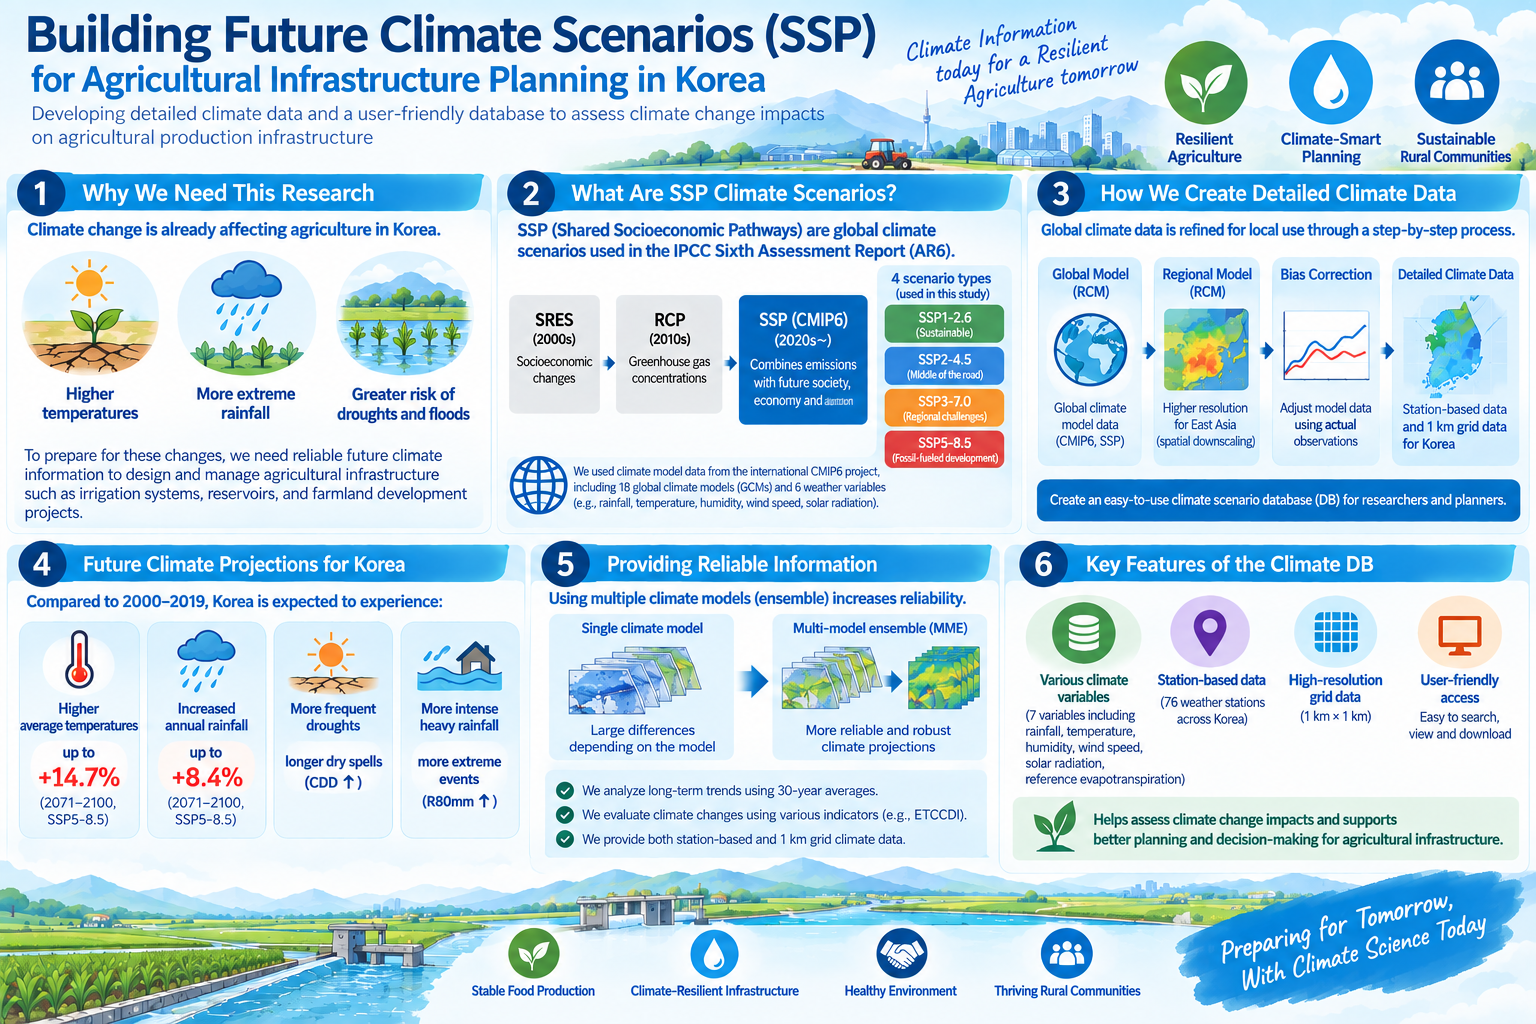
Methodology and Guideline for Climate Change Impact Assessment in Rural Infrastructure Projects
In 2023 the Institute of Watershed Management (IWMI) developed a methodology and guideline for assessing climate change impacts in agricultu…
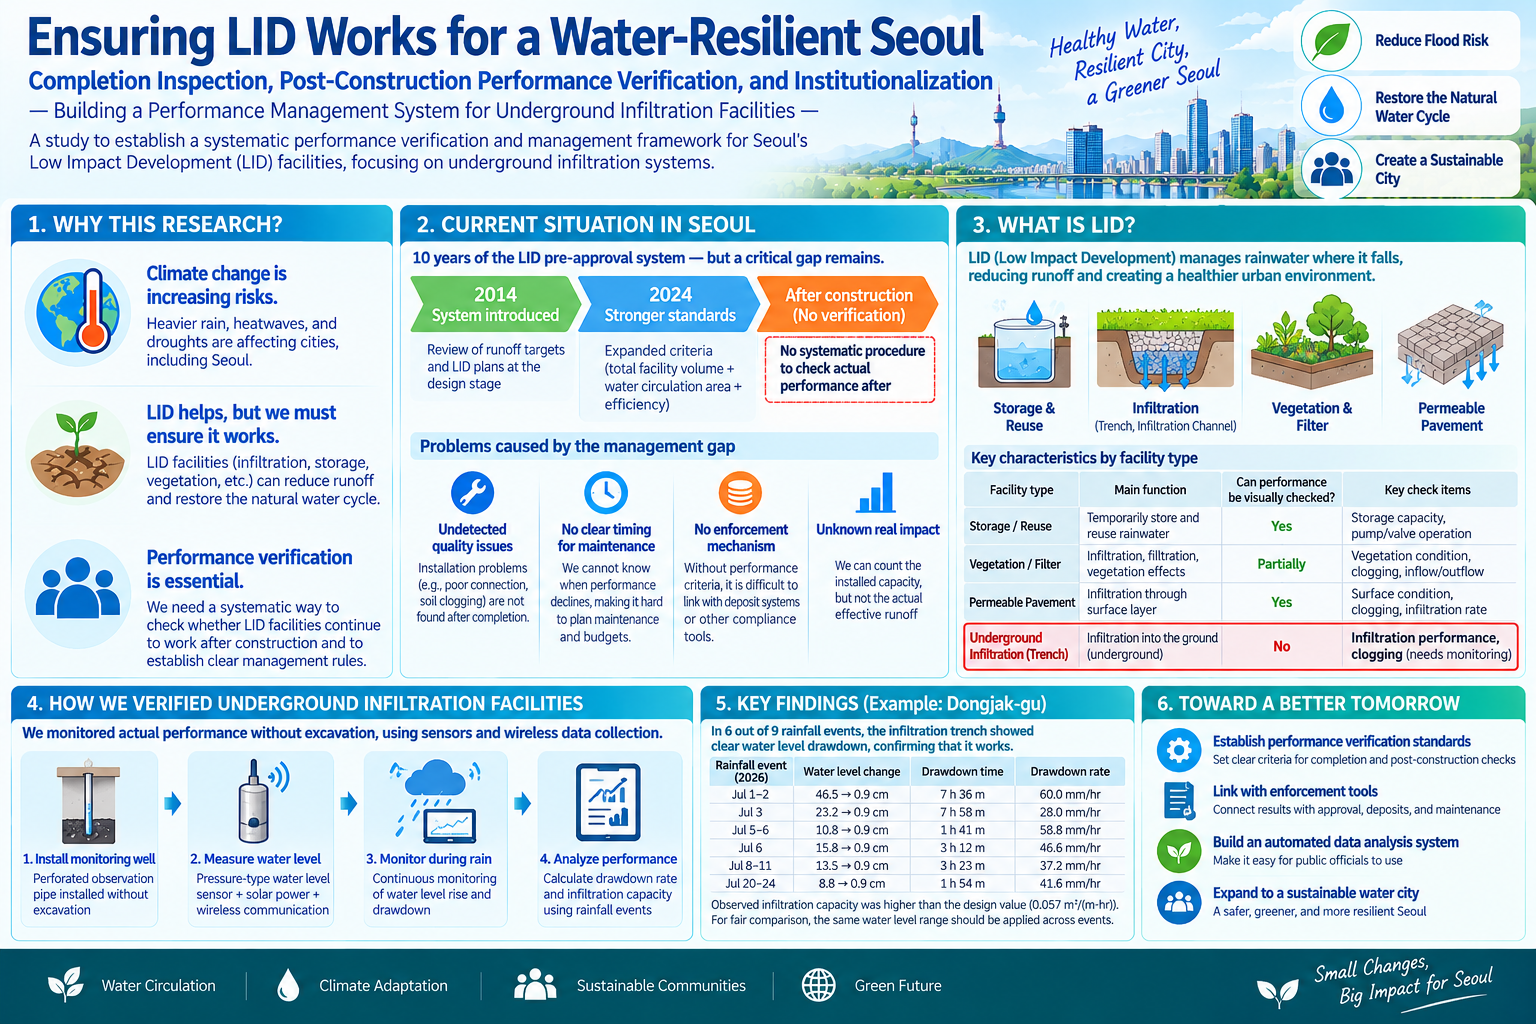
Performance Verification and Institutionalisation for Seoul's LID Facilities
The Institute of Watershed Management (IWMI) conducted a study on commissioning and post-construction performance verification for low impac…